Recovery_DRC
Emma M Pfortmiller
2025-02-28
Last updated: 2025-03-07
Checks: 7 0
Knit directory: Recovery_5FU/
This reproducible R Markdown analysis was created with workflowr (version 1.7.1). The Checks tab describes the reproducibility checks that were applied when the results were created. The Past versions tab lists the development history.
Great! Since the R Markdown file has been committed to the Git repository, you know the exact version of the code that produced these results.
Great job! The global environment was empty. Objects defined in the global environment can affect the analysis in your R Markdown file in unknown ways. For reproduciblity it’s best to always run the code in an empty environment.
The command set.seed(20250217) was run prior to running
the code in the R Markdown file. Setting a seed ensures that any results
that rely on randomness, e.g. subsampling or permutations, are
reproducible.
Great job! Recording the operating system, R version, and package versions is critical for reproducibility.
Nice! There were no cached chunks for this analysis, so you can be confident that you successfully produced the results during this run.
Great job! Using relative paths to the files within your workflowr project makes it easier to run your code on other machines.
Great! You are using Git for version control. Tracking code development and connecting the code version to the results is critical for reproducibility.
The results in this page were generated with repository version dba3d2a. See the Past versions tab to see a history of the changes made to the R Markdown and HTML files.
Note that you need to be careful to ensure that all relevant files for
the analysis have been committed to Git prior to generating the results
(you can use wflow_publish or
wflow_git_commit). workflowr only checks the R Markdown
file, but you know if there are other scripts or data files that it
depends on. Below is the status of the Git repository when the results
were generated:
Ignored files:
    Ignored:    .Rhistory
    Ignored:    .Rproj.user/

Untracked files:
    Untracked:  MDM2_boxplot_1500x600_EMP_250307.png
    Untracked:  MDM2_boxplot_grouped_1500x600_EMP_250307.png

Unstaged changes:
    Modified:   analysis/Recovery_DE.Rmd
Note that any generated files, e.g. HTML, png, CSS, etc., are not included in this status report because it is ok for generated content to have uncommitted changes.
These are the previous versions of the repository in which changes were
made to the R Markdown (analysis/Recovery_DRC.Rmd) and HTML
(docs/Recovery_DRC.html) files. If you’ve configured a
remote Git repository (see ?wflow_git_remote), click on the
hyperlinks in the table below to view the files as they were in that
past version.
| File | Version | Author | Date | Message |
|---|---|---|---|---|
| html | 109e14b | emmapfort | 2025-03-03 | Build site. |
| Rmd | f49b130 | emmapfort | 2025-03-03 | Add in Dose Response Experiment |
| Rmd | 94abbf3 | emmapfort | 2025-02-28 | RUVs updates |
This contains data from all three individuals used for this timecourse experiment 75-1, 78-1, 17-3 iPSCs 50,000 cells in 60 wells of 6x 96 well plates Treated with varying concentrations of doxrubicin, 5-fluorouracil, and DMSO vehicle matched controls
── Attaching core tidyverse packages ──────────────────────── tidyverse 2.0.0 ──
✔ dplyr     1.1.4     ✔ readr     2.1.5
✔ forcats   1.0.0     ✔ stringr   1.5.1
✔ ggplot2   3.5.1     ✔ tibble    3.2.1
✔ lubridate 1.9.3     ✔ tidyr     1.3.1
✔ purrr     1.0.2
── Conflicts ────────────────────────────────────────── tidyverse_conflicts() ──
✖ dplyr::filter() masks stats::filter()
✖ dplyr::lag()    masks stats::lag()
ℹ Use the conflicted package (<http://conflicted.r-lib.org/>) to force all conflicts to become errors

Attaching package: 'scales'


The following object is masked from 'package:purrr':

    discard


The following object is masked from 'package:readr':

    col_factor


Loading required package: MASS


Attaching package: 'MASS'


The following object is masked from 'package:dplyr':

    select


'drc' has been loaded.


Please cite R and 'drc' if used for a publication,

for references type 'citation()' and 'citation('drc')'.


Attaching package: 'drc'


The following objects are masked from 'package:stats':

    gaussian, getInitial
Import Datasets
AllData <- read_excel("C:/Users/emmap/OneDrive/Desktop/Ward Lab/Experiments/5FU Project/DRCs/5FUProj_DRCTime_78-1_75-1_17-3_EMP_240226.xlsx",
     sheet = "Fin_Sheet_Analysis")
View(AllData)

Ind1_75_data <- read_excel("C:/Users/emmap/OneDrive/Desktop/Ward Lab/Experiments/5FU Project/DRCs/5FUProj_DRCTime_78-1_75-1_17-3_EMP_240226.xlsx",
     sheet = "Fin_75_Sheet")
View(Ind1_75_data)

Ind2_78_data <- read_excel("C:/Users/emmap/OneDrive/Desktop/Ward Lab/Experiments/5FU Project/DRCs/5FUProj_DRCTime_78-1_75-1_17-3_EMP_240226.xlsx",
     sheet = "Fin_78_Sheet")
View(Ind2_78_data)

Ind3_17_data <- read_excel("C:/Users/emmap/OneDrive/Desktop/Ward Lab/Experiments/5FU Project/DRCs/5FUProj_DRCTime_78-1_75-1_17-3_EMP_240226.xlsx",
     sheet = "Fin_17_Sheet")
View(Ind3_17_data)
Now that I’ve imported my data, let’s go ahead and filter the data to reflect time and treatment groups.
I have three timepoints that I’m investigating through this experiment, they will be treated separately Let’s filter the data accordingly by timepoint (24hr, 48hr, 72hr)
Now that these are filtered by individual, time, and drug - I will start plotting the data
First, I’ll plot the 24hr timepoint raw data
#####DOX Samples#####
#dox 78-1 24HR
par(mar = c(3.0, 3.0, 1.2, 1), mgp = c(2, .7, 0))
layout(matrix(c(1, 2, 1, 3), nrow = 2, ncol = 2), heights = c(0.5, 2, 2, 2))
#layout.show(3)
plot.new()
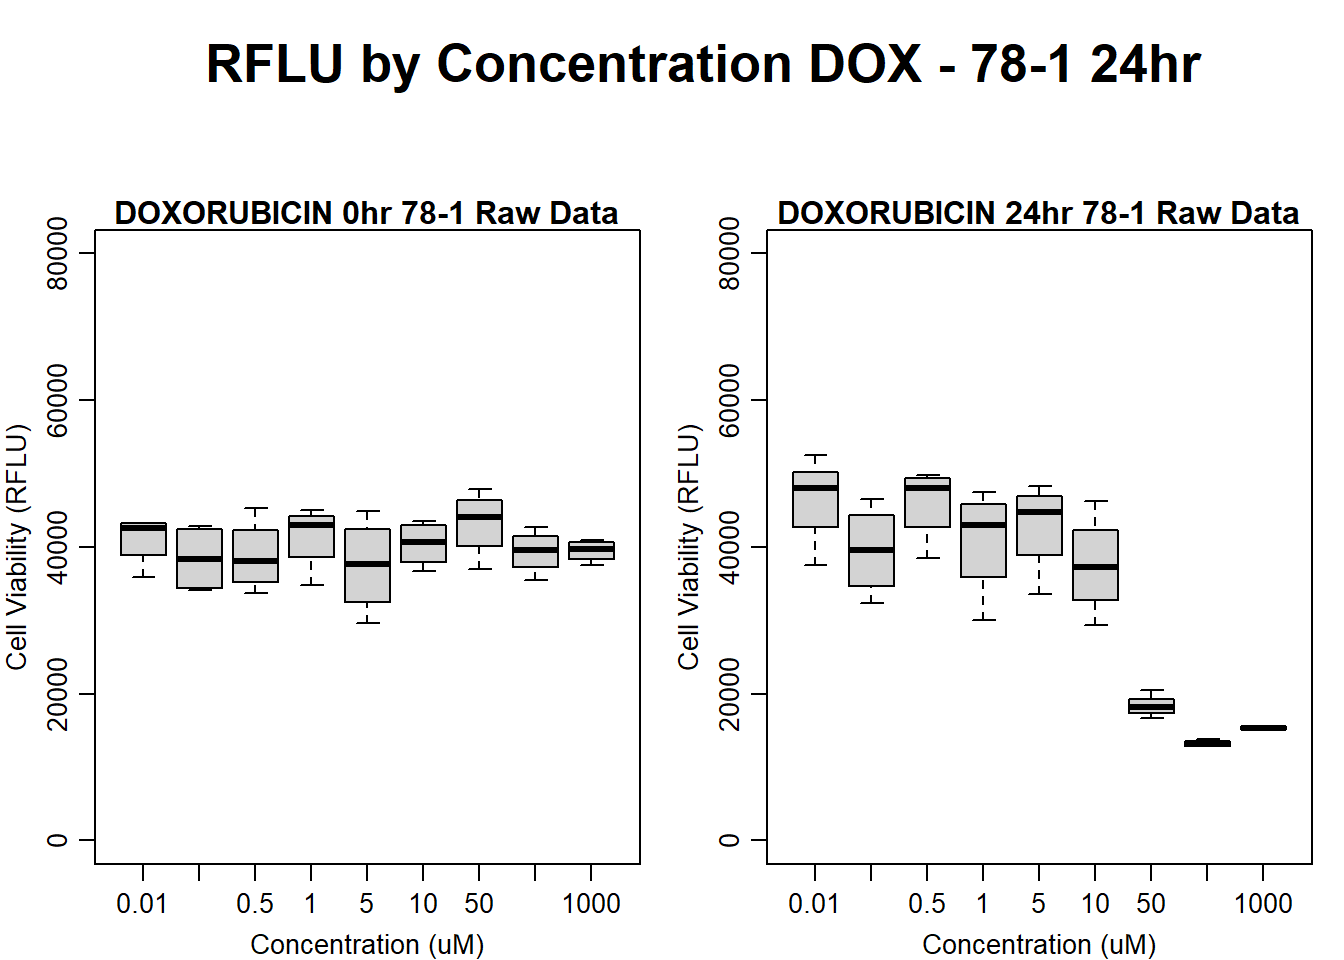
text(0.5,0.5,"RFLU by Concentration DOX - 78-1 24hr",cex = 2,font = 2)
boxplot(dox24hr78$Ind2_78_In ~ dox24hr78$Conc,
ylim = c(0, 80000),
ylab = "Cell Viability (RFLU)",
xlab = "Concentration (uM)",
main = "DOXORUBICIN 0hr 78-1 Raw Data"
)
boxplot(dox24hr78$Ind2_78_Fin ~ dox24hr78$Conc,
ylim = c(0,80000),
ylab = "Cell Viability (RFLU)",
xlab = "Concentration (uM)",
main = "DOXORUBICIN 24hr 78-1 Raw Data"
)
| Version | Author | Date |
|---|---|---|
| 109e14b | emmapfort | 2025-03-03 |
#dox 75-1 24HR
par(mar = c(3.0, 3.0, 1.2, 1), mgp = c(2, .7, 0))
layout(matrix(c(1, 2, 1, 3), nrow = 2, ncol = 2), heights = c(0.5, 2, 2, 2))
#layout.show(3)
plot.new()
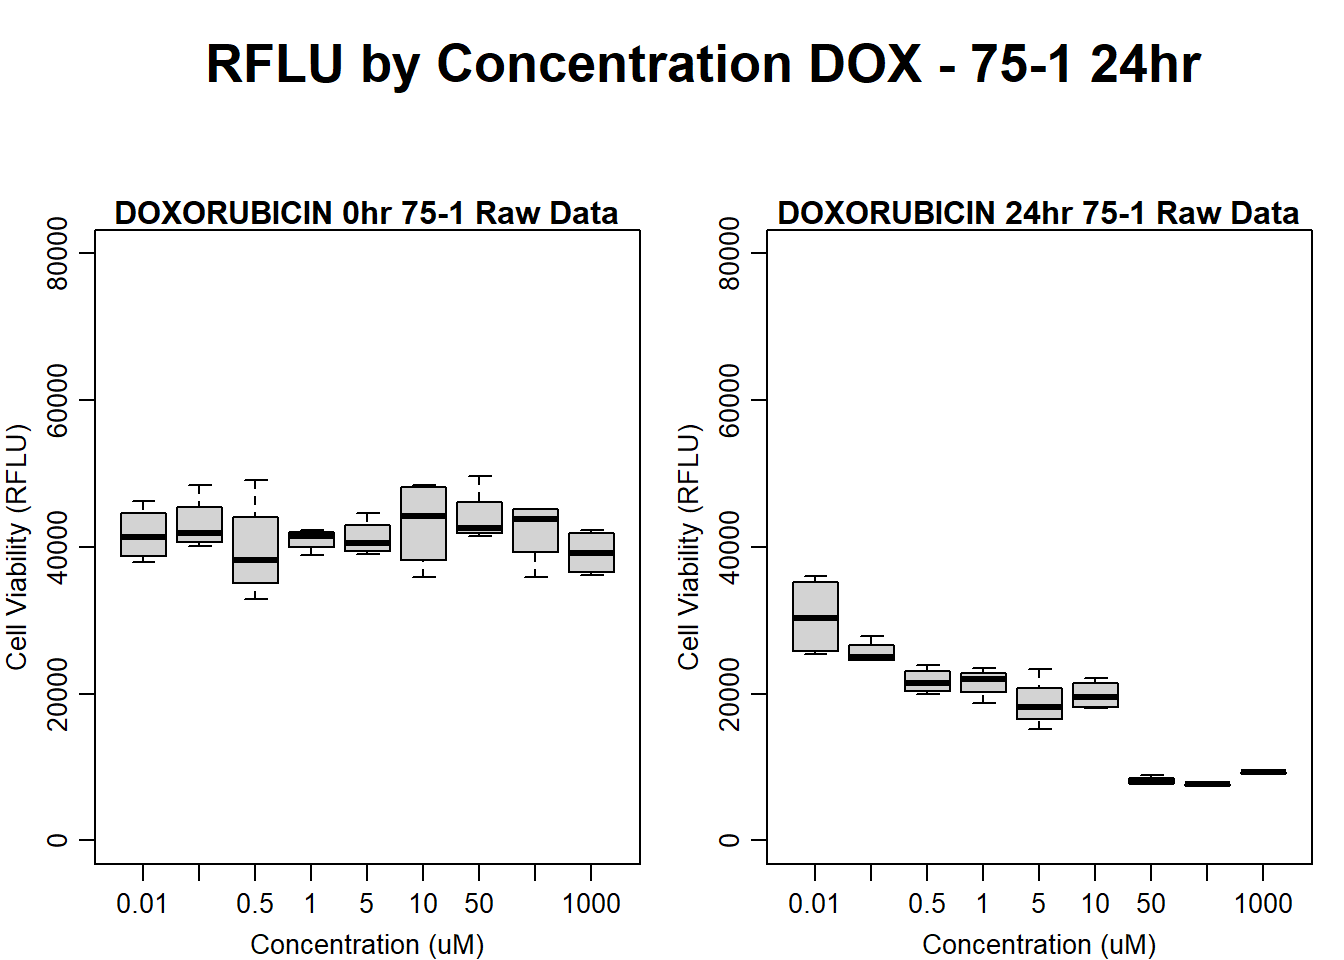
text(0.5,0.5,"RFLU by Concentration DOX - 75-1 24hr",cex = 2,font = 2)
boxplot(dox24hr75$Ind1_75_In ~ dox24hr75$Conc,
ylim = c(0, 80000),
ylab = "Cell Viability (RFLU)",
xlab = "Concentration (uM)",
main = "DOXORUBICIN 0hr 75-1 Raw Data"
)
boxplot(dox24hr75$Ind1_75_Fin ~ dox24hr75$Conc,
ylim = c(0,80000),
ylab = "Cell Viability (RFLU)",
xlab = "Concentration (uM)",
main = "DOXORUBICIN 24hr 75-1 Raw Data"
)
| Version | Author | Date |
|---|---|---|
| 109e14b | emmapfort | 2025-03-03 |
#dox 17-3 24HR
par(mar = c(3.0, 3.0, 1.2, 1), mgp = c(2, .7, 0))
layout(matrix(c(1, 2, 1, 3), nrow = 2, ncol = 2), heights = c(0.5, 2, 2, 2))
#layout.show(3)
plot.new()
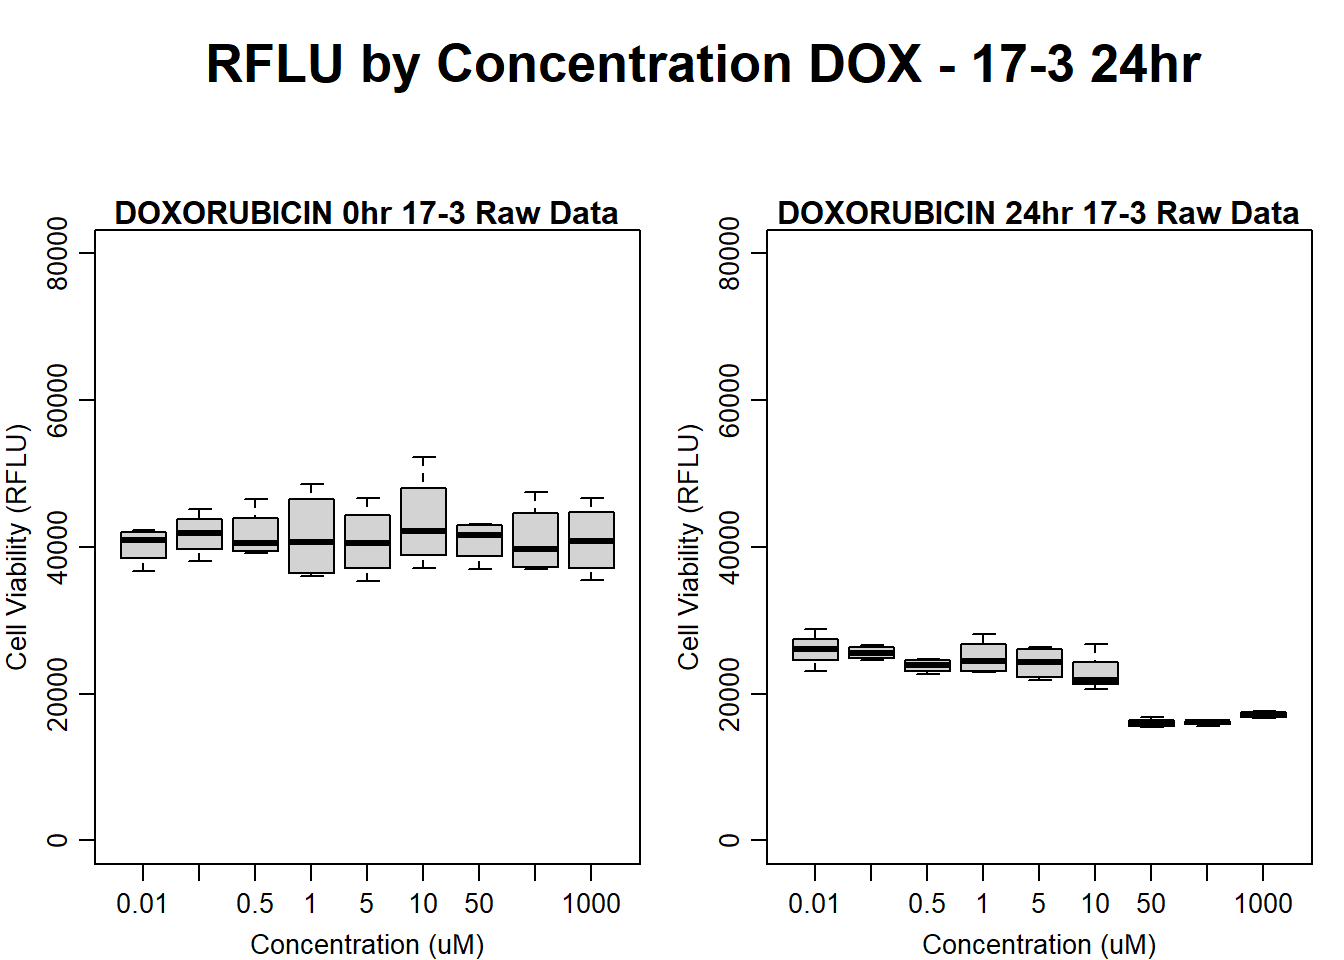
text(0.5,0.5,"RFLU by Concentration DOX - 17-3 24hr",cex = 2,font = 2)
boxplot(dox24hr17$Ind3_17_In ~ dox24hr17$Conc,
ylim = c(0, 80000),
ylab = "Cell Viability (RFLU)",
xlab = "Concentration (uM)",
main = "DOXORUBICIN 0hr 17-3 Raw Data"
)
boxplot(dox24hr17$Ind3_17_Fin ~ dox24hr17$Conc,
ylim = c(0,80000),
ylab = "Cell Viability (RFLU)",
xlab = "Concentration (uM)",
main = "DOXORUBICIN 24hr 17-3 Raw Data"
)
| Version | Author | Date |
|---|---|---|
| 109e14b | emmapfort | 2025-03-03 |
#####FLUO samples#####
#FLUO 78-1 24HR
par(mar = c(3.0, 3.0, 1.2, 1), mgp = c(2, .7, 0))
layout(matrix(c(1, 2, 1, 3), nrow = 2, ncol = 2), heights = c(0.5, 2, 2, 2))
#layout.show(3)
plot.new()
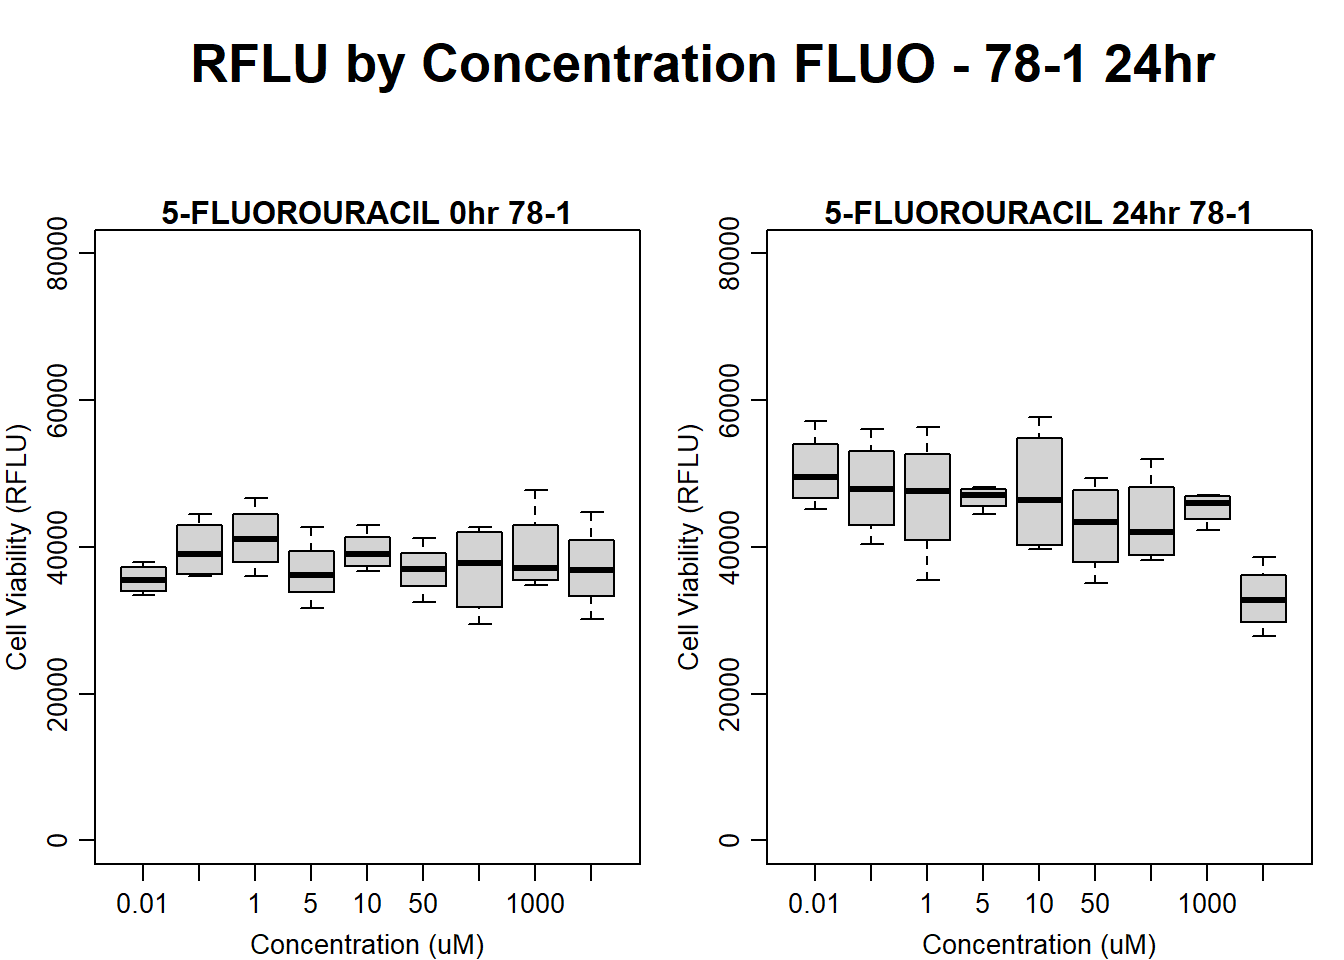
text(0.5,0.5,"RFLU by Concentration FLUO - 78-1 24hr",cex = 2,font = 2)
boxplot(fluo24hr78$Ind2_78_In ~ fluo24hr78$Conc,
ylim = c(0, 80000),
ylab = "Cell Viability (RFLU)",
xlab = "Concentration (uM)",
main = "5-FLUOROURACIL 0hr 78-1"
)
boxplot(fluo24hr78$Ind2_78_Fin ~ fluo24hr78$Conc,
ylim = c(0,80000),
ylab = "Cell Viability (RFLU)",
xlab = "Concentration (uM)",
main = "5-FLUOROURACIL 24hr 78-1"
)
| Version | Author | Date |
|---|---|---|
| 109e14b | emmapfort | 2025-03-03 |
#FLUO 75-1 24HR
par(mar = c(3.0, 3.0, 1.2, 1), mgp = c(2, .7, 0))
layout(matrix(c(1, 2, 1, 3), nrow = 2, ncol = 2), heights = c(0.5, 2, 2, 2))
#layout.show(3)
plot.new()
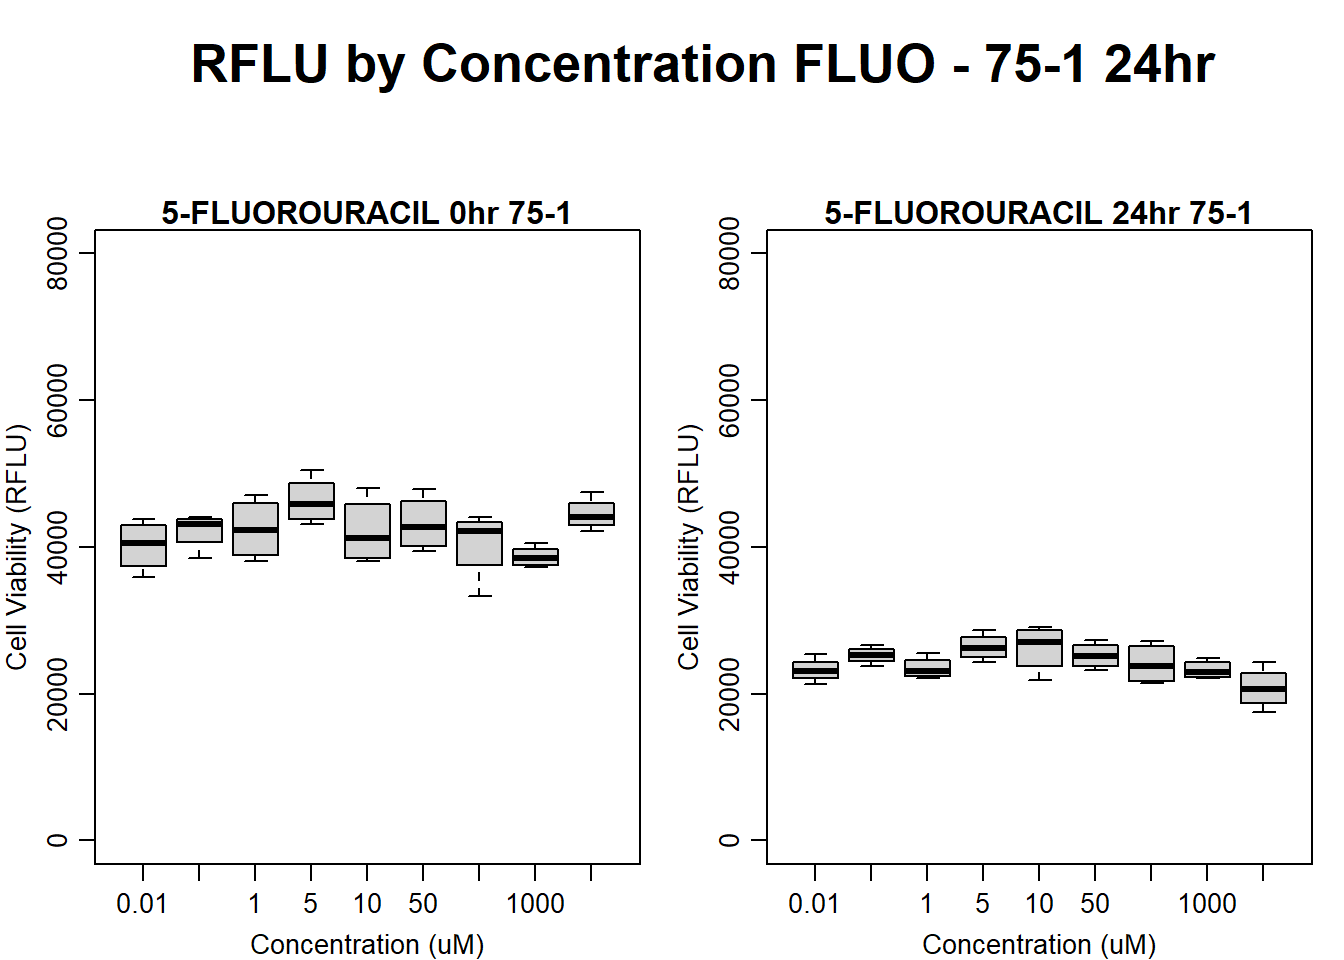
text(0.5,0.5,"RFLU by Concentration FLUO - 75-1 24hr",cex = 2,font = 2)
boxplot(fluo24hr75$Ind1_75_In ~ fluo24hr75$Conc,
ylim = c(0, 80000),
ylab = "Cell Viability (RFLU)",
xlab = "Concentration (uM)",
main = "5-FLUOROURACIL 0hr 75-1"
)
boxplot(fluo24hr75$Ind1_75_Fin ~ fluo24hr75$Conc,
ylim = c(0,80000),
ylab = "Cell Viability (RFLU)",
xlab = "Concentration (uM)",
main = "5-FLUOROURACIL 24hr 75-1"
)
| Version | Author | Date |
|---|---|---|
| 109e14b | emmapfort | 2025-03-03 |
#FLUO 17-3 24HR
par(mar = c(3.0, 3.0, 1.2, 1), mgp = c(2, .7, 0))
layout(matrix(c(1, 2, 1, 3), nrow = 2, ncol = 2), heights = c(0.5, 2, 2, 2))
#layout.show(3)
plot.new()
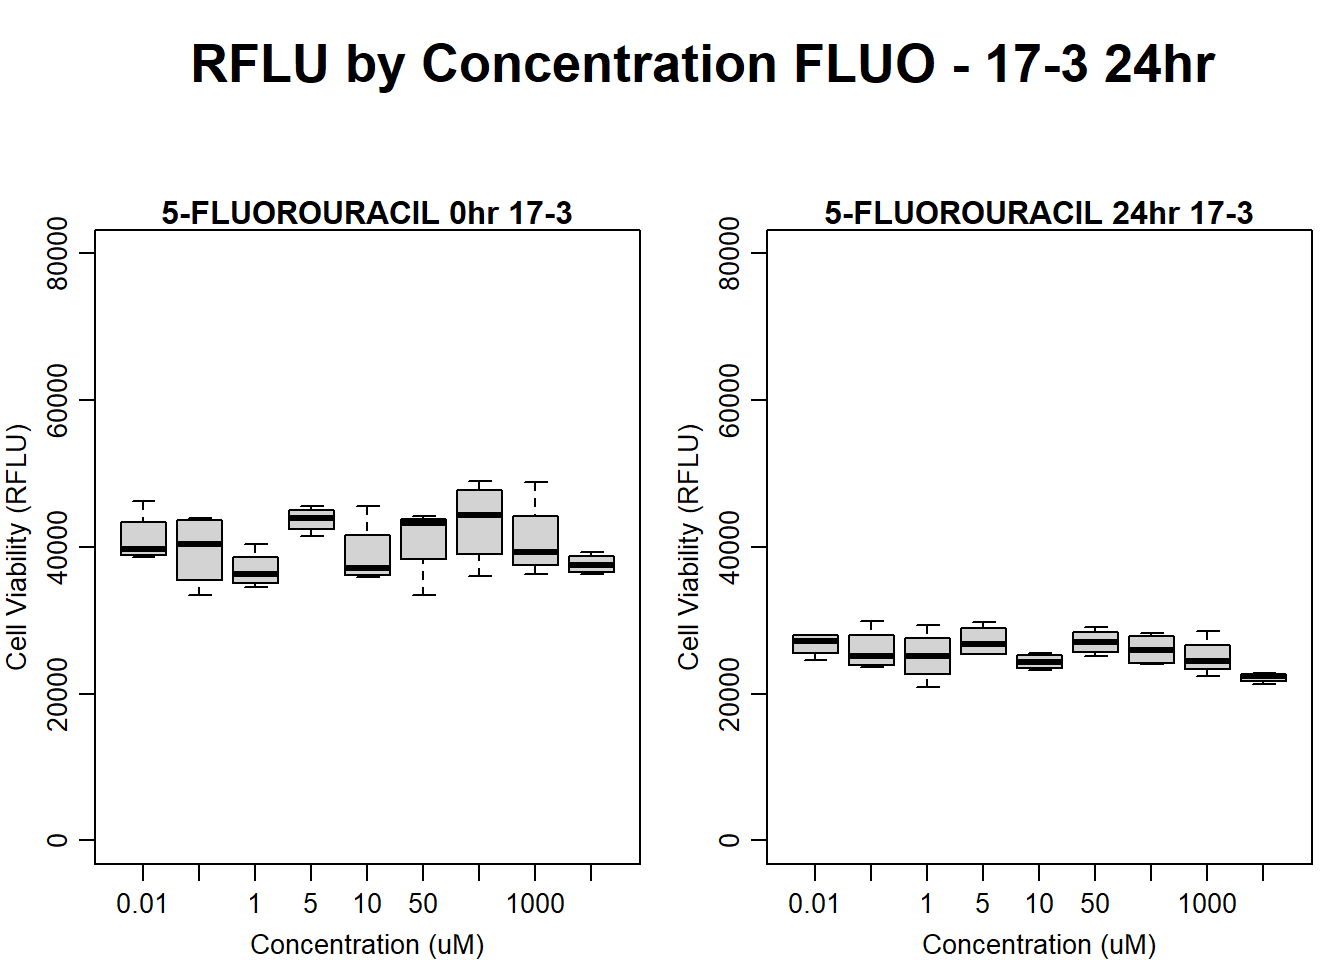
text(0.5,0.5,"RFLU by Concentration FLUO - 17-3 24hr",cex = 2,font = 2)
boxplot(fluo24hr17$Ind3_17_In ~ fluo24hr17$Conc,
ylim = c(0, 80000),
ylab = "Cell Viability (RFLU)",
xlab = "Concentration (uM)",
main = "5-FLUOROURACIL 0hr 17-3"
)
boxplot(fluo24hr17$Ind3_17_Fin ~ fluo24hr17$Conc,
ylim = c(0, 80000),
ylab = "Cell Viability (RFLU)",
xlab = "Concentration (uM)",
main = "5-FLUOROURACIL 24hr 17-3"
)
| Version | Author | Date |
|---|---|---|
| 109e14b | emmapfort | 2025-03-03 |
#####DMSO samples#####
#DMSO 78-1 24HR
par(mar = c(3.0, 3.0, 1.2, 1), mgp = c(2, .7, 0))
layout(matrix(c(1, 2, 1, 3), nrow = 2, ncol = 2), heights = c(0.5, 2, 2, 2))
#layout.show(3)
plot.new()
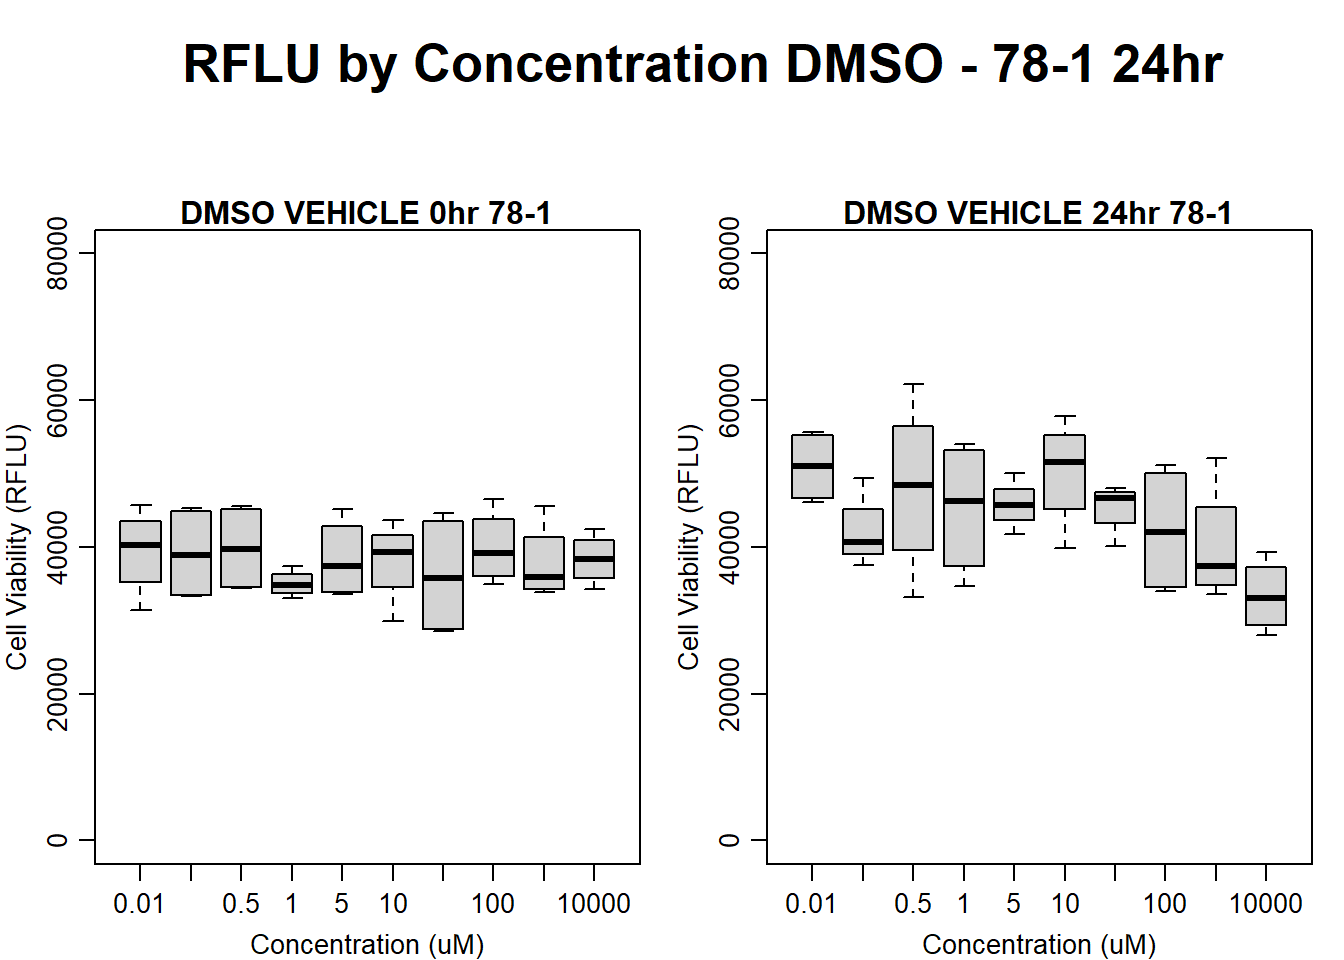
text(0.5,0.5,"RFLU by Concentration DMSO - 78-1 24hr",cex = 2,font = 2)
boxplot(dmso24hr78$Ind2_78_In ~ dmso24hr78$Conc,
ylim = c(0, 80000),
ylab = "Cell Viability (RFLU)",
xlab = "Concentration (uM)",
main = "DMSO VEHICLE 0hr 78-1"
)
boxplot(dmso24hr78$Ind2_78_Fin ~ dmso24hr78$Conc,
ylim = c(0,80000),
ylab = "Cell Viability (RFLU)",
xlab = "Concentration (uM)",
main = "DMSO VEHICLE 24hr 78-1"
)
| Version | Author | Date |
|---|---|---|
| 109e14b | emmapfort | 2025-03-03 |
#DMSO 75-1 24HR
par(mar = c(3.0, 3.0, 1.2, 1), mgp = c(2, .7, 0))
layout(matrix(c(1, 2, 1, 3), nrow = 2, ncol = 2), heights = c(0.5, 2, 2, 2))
#layout.show(3)
plot.new()
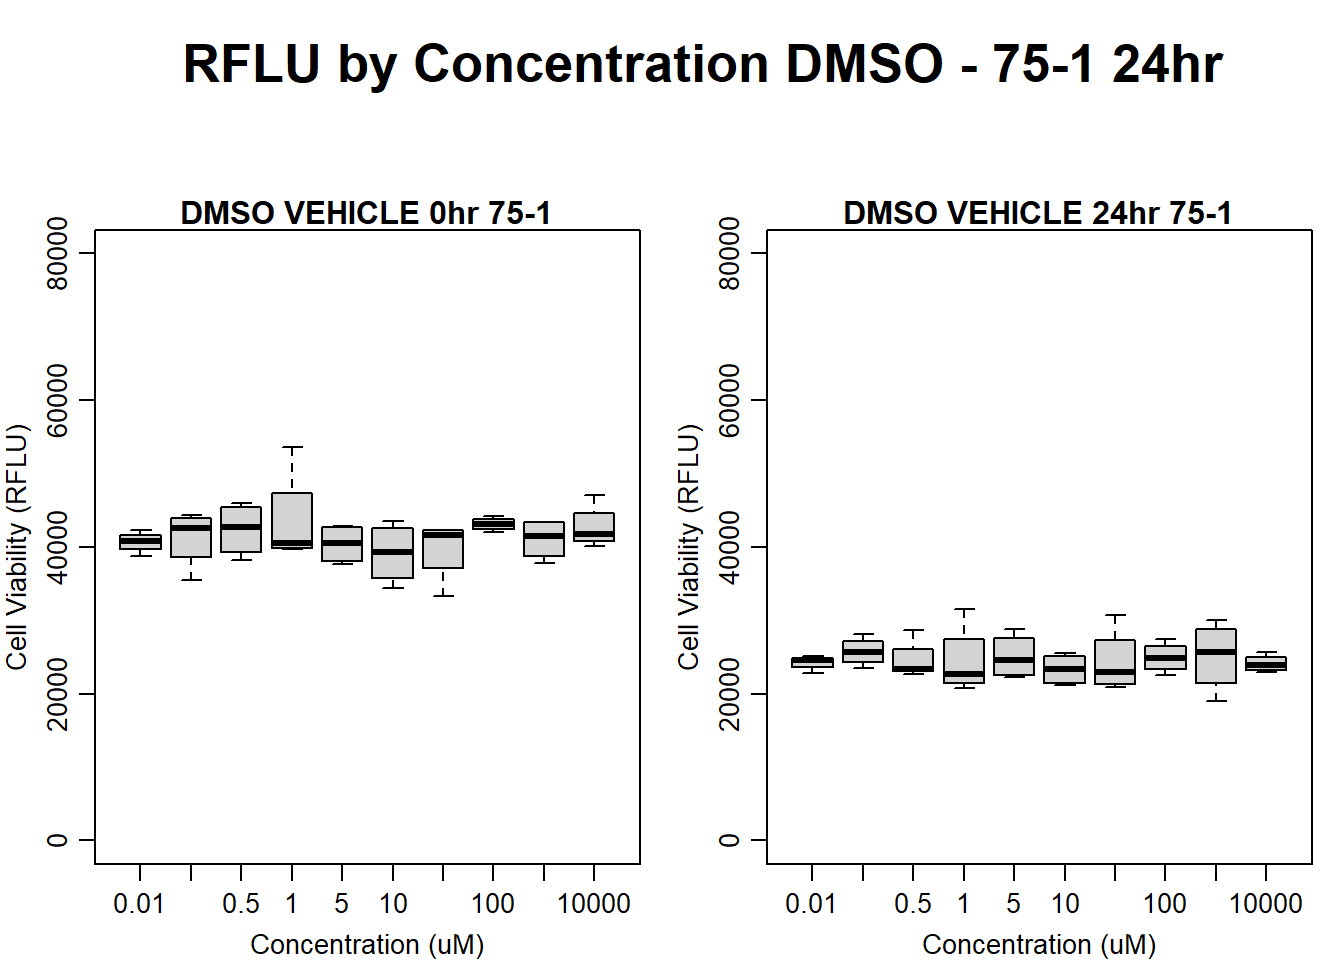
text(0.5,0.5,"RFLU by Concentration DMSO - 75-1 24hr",cex = 2,font = 2)
boxplot(dmso24hr75$Ind1_75_In ~ dmso24hr75$Conc,
ylim = c(0, 80000),
ylab = "Cell Viability (RFLU)",
xlab = "Concentration (uM)",
main = "DMSO VEHICLE 0hr 75-1"
)
boxplot(dmso24hr75$Ind1_75_Fin ~ dmso24hr75$Conc,
ylim = c(0,80000),
ylab = "Cell Viability (RFLU)",
xlab = "Concentration (uM)",
main = "DMSO VEHICLE 24hr 75-1"
)
| Version | Author | Date |
|---|---|---|
| 109e14b | emmapfort | 2025-03-03 |
#DMSO 17-3 24HR
par(mar = c(3.0, 3.0, 1.2, 1), mgp = c(2, .7, 0))
layout(matrix(c(1, 2, 1, 3), nrow = 2, ncol = 2), heights = c(0.5, 2, 2, 2))
#layout.show(3)
plot.new()
text(0.5,0.5,"RFLU by Concentration DMSO - 17-3 24hr",cex = 2,font = 2)

boxplot(dmso24hr17$Ind3_17_In ~ dmso24hr17$Conc,
        ylim = c(0, 80000),
        ylab = "Cell Viability (RFLU)",
        xlab = "Concentration (uM)",
        main = "DMSO VEHICLE 0hr 17-3"
)

boxplot(dmso24hr17$Ind3_17_Fin ~ dmso24hr17$Conc,
        ylim = c(0,80000),
        ylab = "Cell Viability (RFLU)",
        xlab = "Concentration (uM)",
        main = "DMSO VEHICLE 24hr 17-3"
)
| Version | Author | Date |
|---|---|---|
| 109e14b | emmapfort | 2025-03-03 |
Now let’s look at the raw data for the 48hr timepoint
#####DOX Samples#####
#DOX 78-1 48HR
par(mar = c(3.0, 3.0, 1.2, 1), mgp = c(2, .7, 0))
layout(matrix(c(1, 2, 1, 3), nrow = 2, ncol = 2), heights = c(0.5, 2, 2, 2))
#layout.show(3)
plot.new()
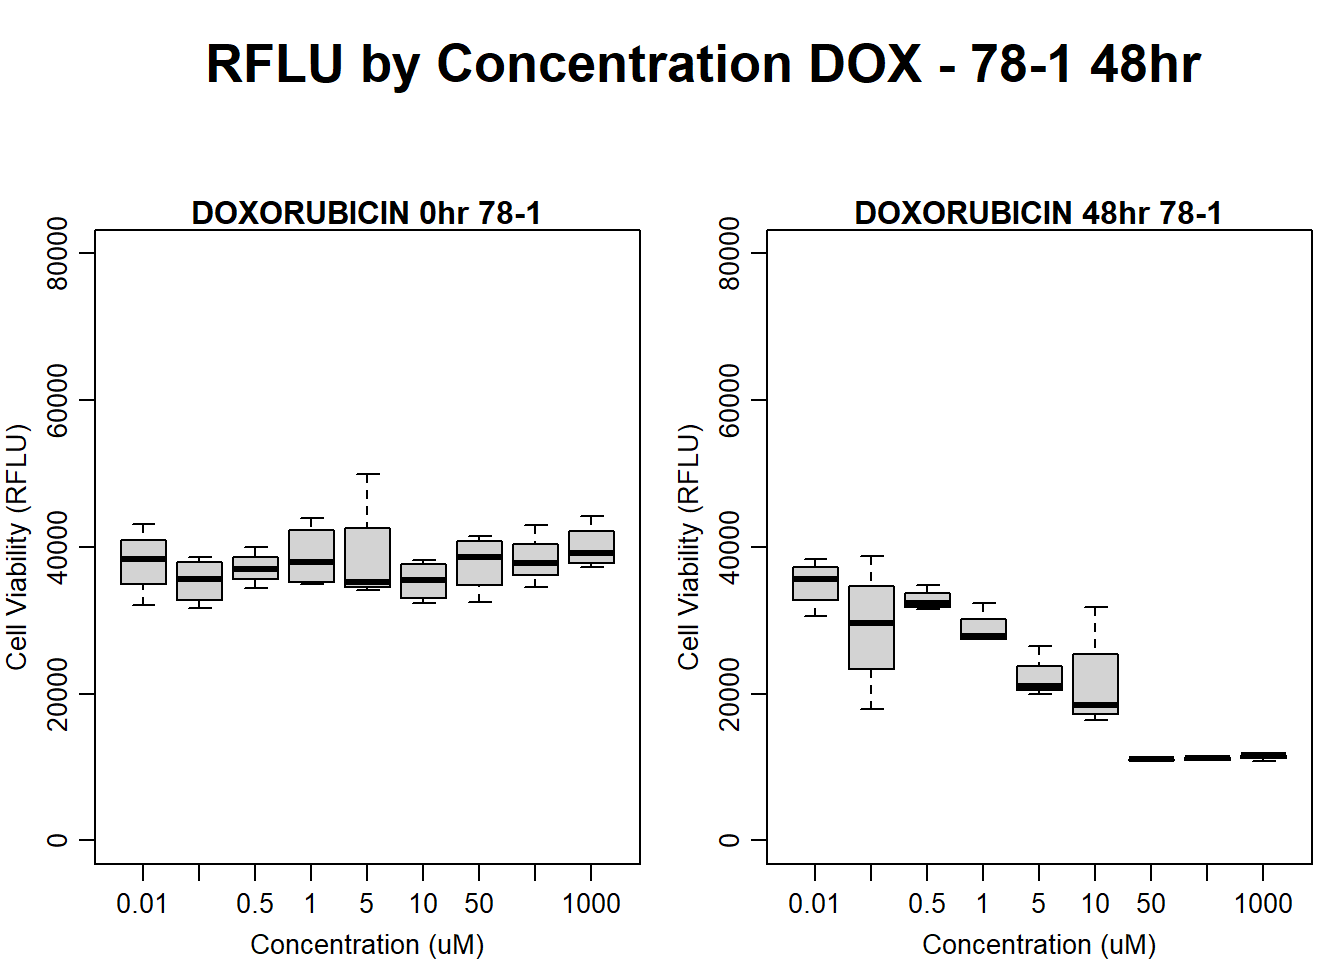
text(0.5,0.5,"RFLU by Concentration DOX - 78-1 48hr",cex = 2,font = 2)
boxplot(dox48hr78$Ind2_78_In ~ dox48hr78$Conc,
ylim = c(0, 80000),
ylab = "Cell Viability (RFLU)",
xlab = "Concentration (uM)",
main = "DOXORUBICIN 0hr 78-1"
)
boxplot(dox48hr78$Ind2_78_Fin ~ dox48hr78$Conc,
ylim = c(0,80000),
ylab = "Cell Viability (RFLU)",
xlab = "Concentration (uM)",
main = "DOXORUBICIN 48hr 78-1"
)
| Version | Author | Date |
|---|---|---|
| 109e14b | emmapfort | 2025-03-03 |
#DOXO 75-1 48HR
par(mar = c(3.0, 3.0, 1.2, 1), mgp = c(2, .7, 0))
layout(matrix(c(1, 2, 1, 3), nrow = 2, ncol = 2), heights = c(0.5, 2, 2, 2))
#layout.show(3)
plot.new()
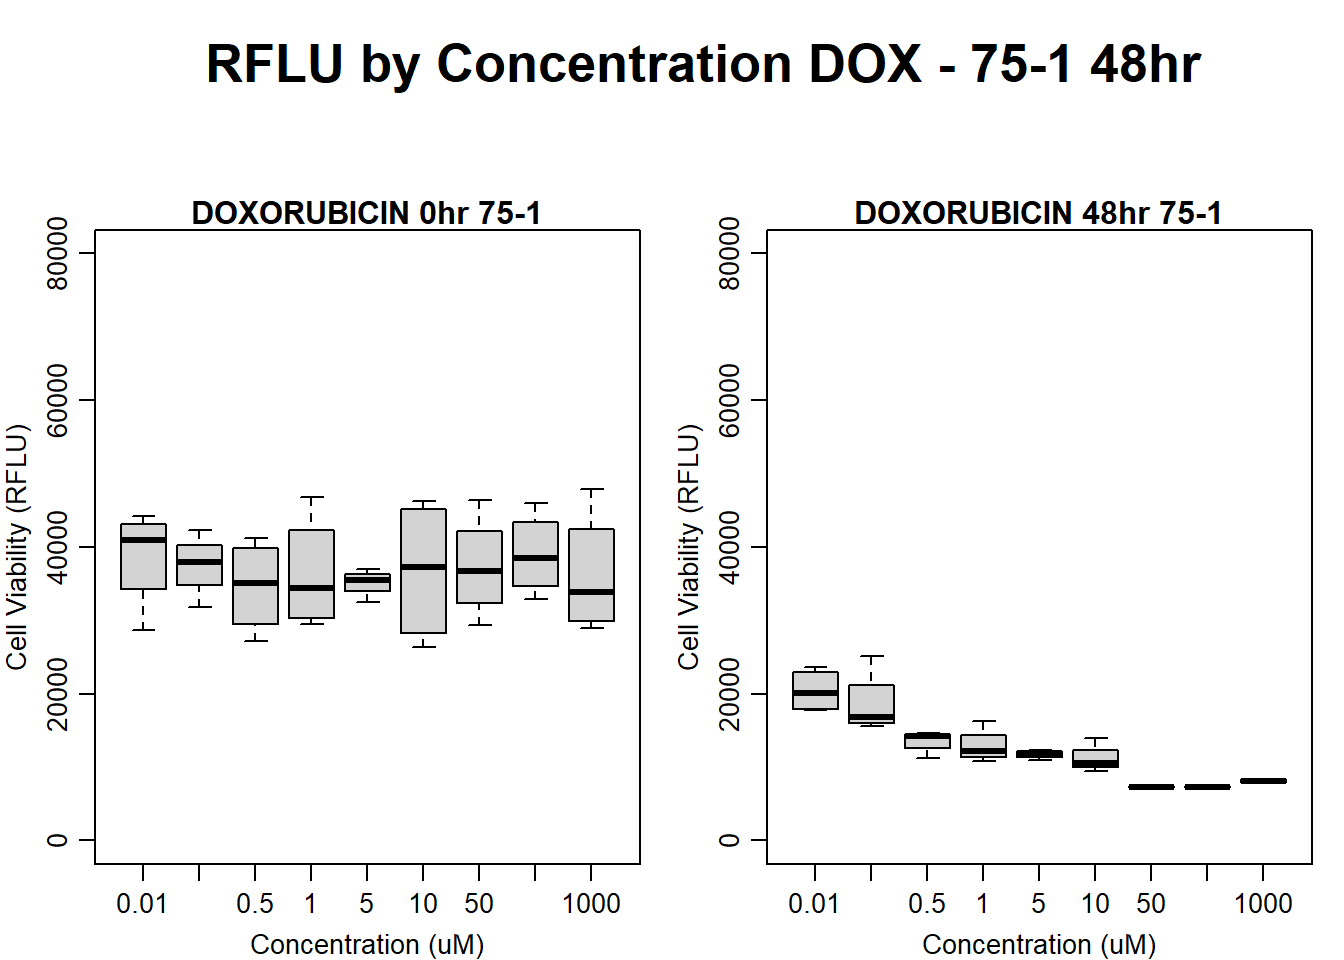
text(0.5,0.5,"RFLU by Concentration DOX - 75-1 48hr",cex = 2,font = 2)
boxplot(dox48hr75$Ind1_75_In ~ dox48hr75$Conc,
ylim = c(0, 80000),
ylab = "Cell Viability (RFLU)",
xlab = "Concentration (uM)",
main = "DOXORUBICIN 0hr 75-1"
)
boxplot(dox48hr75$Ind1_75_Fin ~ dox48hr75$Conc,
ylim = c(0,80000),
ylab = "Cell Viability (RFLU)",
xlab = "Concentration (uM)",
main = "DOXORUBICIN 48hr 75-1"
)
| Version | Author | Date |
|---|---|---|
| 109e14b | emmapfort | 2025-03-03 |
#DOX 17-3 48HR
par(mar = c(3.0, 3.0, 1.2, 1), mgp = c(2, .7, 0))
layout(matrix(c(1, 2, 1, 3), nrow = 2, ncol = 2), heights = c(0.5, 2, 2, 2))
#layout.show(3)
plot.new()
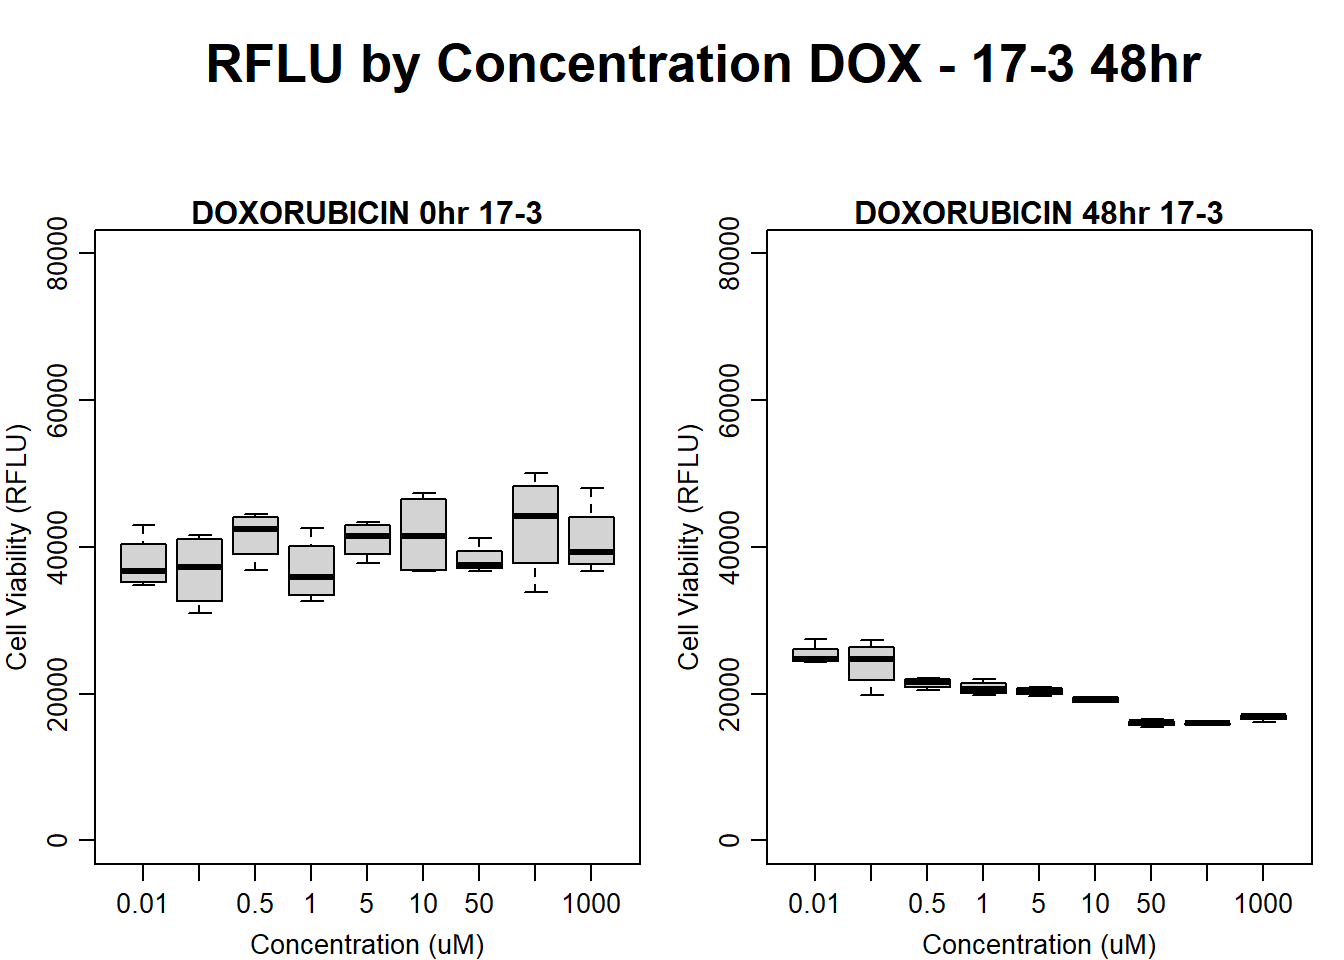
text(0.5,0.5,"RFLU by Concentration DOX - 17-3 48hr",cex = 2,font = 2)
boxplot(dox48hr17$Ind3_17_In ~ dox48hr17$Conc,
ylim = c(0, 80000),
ylab = "Cell Viability (RFLU)",
xlab = "Concentration (uM)",
main = "DOXORUBICIN 0hr 17-3"
)
boxplot(dox48hr17$Ind3_17_Fin ~ dox48hr17$Conc,
ylim = c(0,80000),
ylab = "Cell Viability (RFLU)",
xlab = "Concentration (uM)",
main = "DOXORUBICIN 48hr 17-3"
)
| Version | Author | Date |
|---|---|---|
| 109e14b | emmapfort | 2025-03-03 |
#####FLUO samples#####
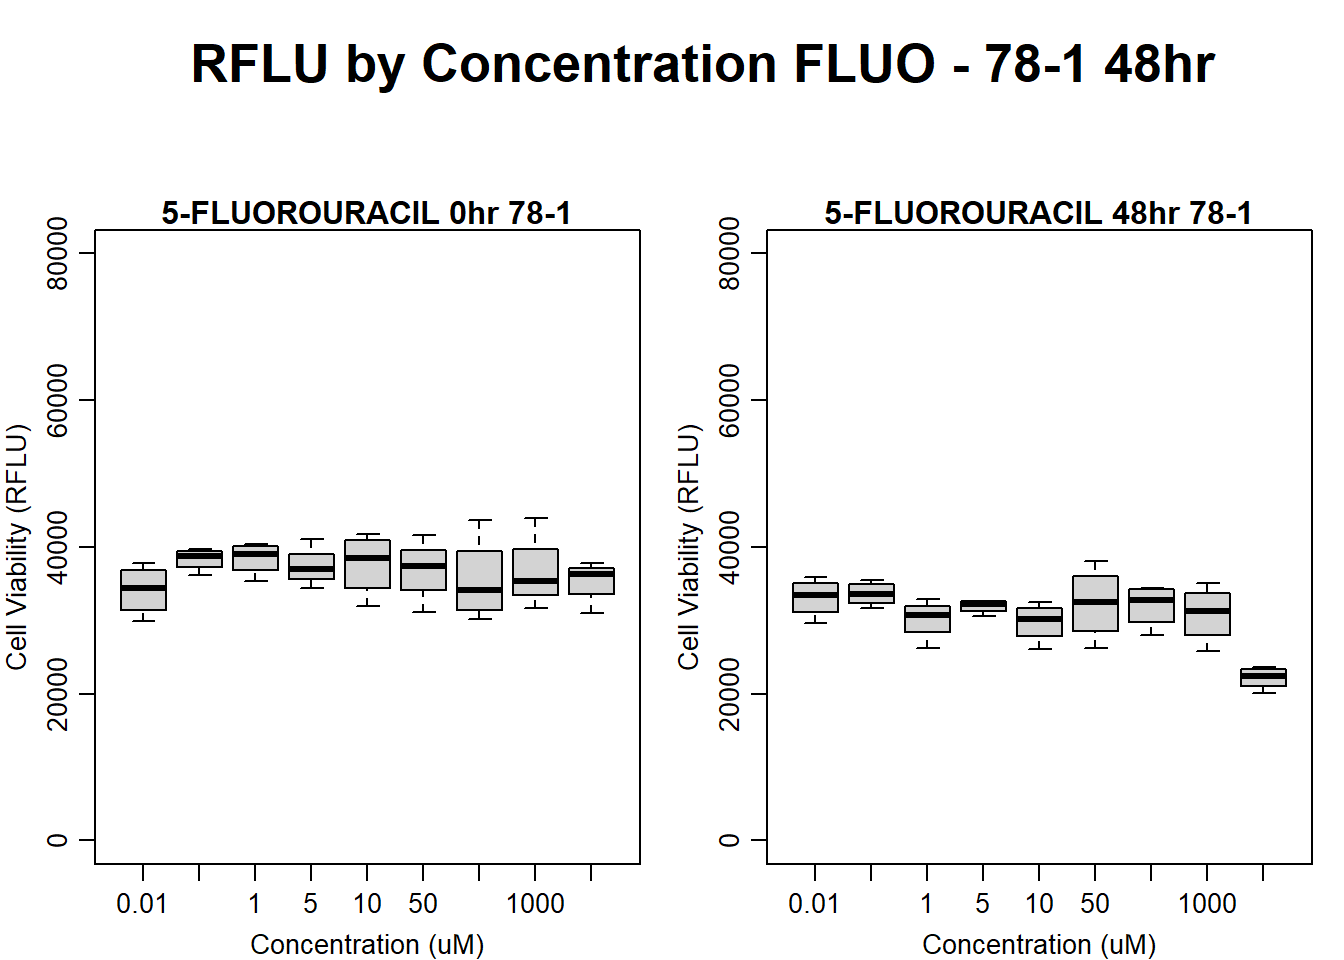
#FLUO 78-1 48HR
par(mar = c(3.0, 3.0, 1.2, 1), mgp = c(2, .7, 0))
layout(matrix(c(1, 2, 1, 3), nrow = 2, ncol = 2), heights = c(0.5, 2, 2, 2))
#layout.show(3)
plot.new()
text(0.5,0.5,"RFLU by Concentration FLUO - 78-1 48hr",cex = 2,font = 2)
boxplot(fluo48hr78$Ind2_78_In ~ fluo48hr78$Conc,
ylim = c(0, 80000),
ylab = "Cell Viability (RFLU)",
xlab = "Concentration (uM)",
main = "5-FLUOROURACIL 0hr 78-1"
)
boxplot(fluo48hr78$Ind2_78_Fin ~ fluo48hr78$Conc,
ylim = c(0,80000),
ylab = "Cell Viability (RFLU)",
xlab = "Concentration (uM)",
main = "5-FLUOROURACIL 48hr 78-1"
)
| Version | Author | Date |
|---|---|---|
| 109e14b | emmapfort | 2025-03-03 |
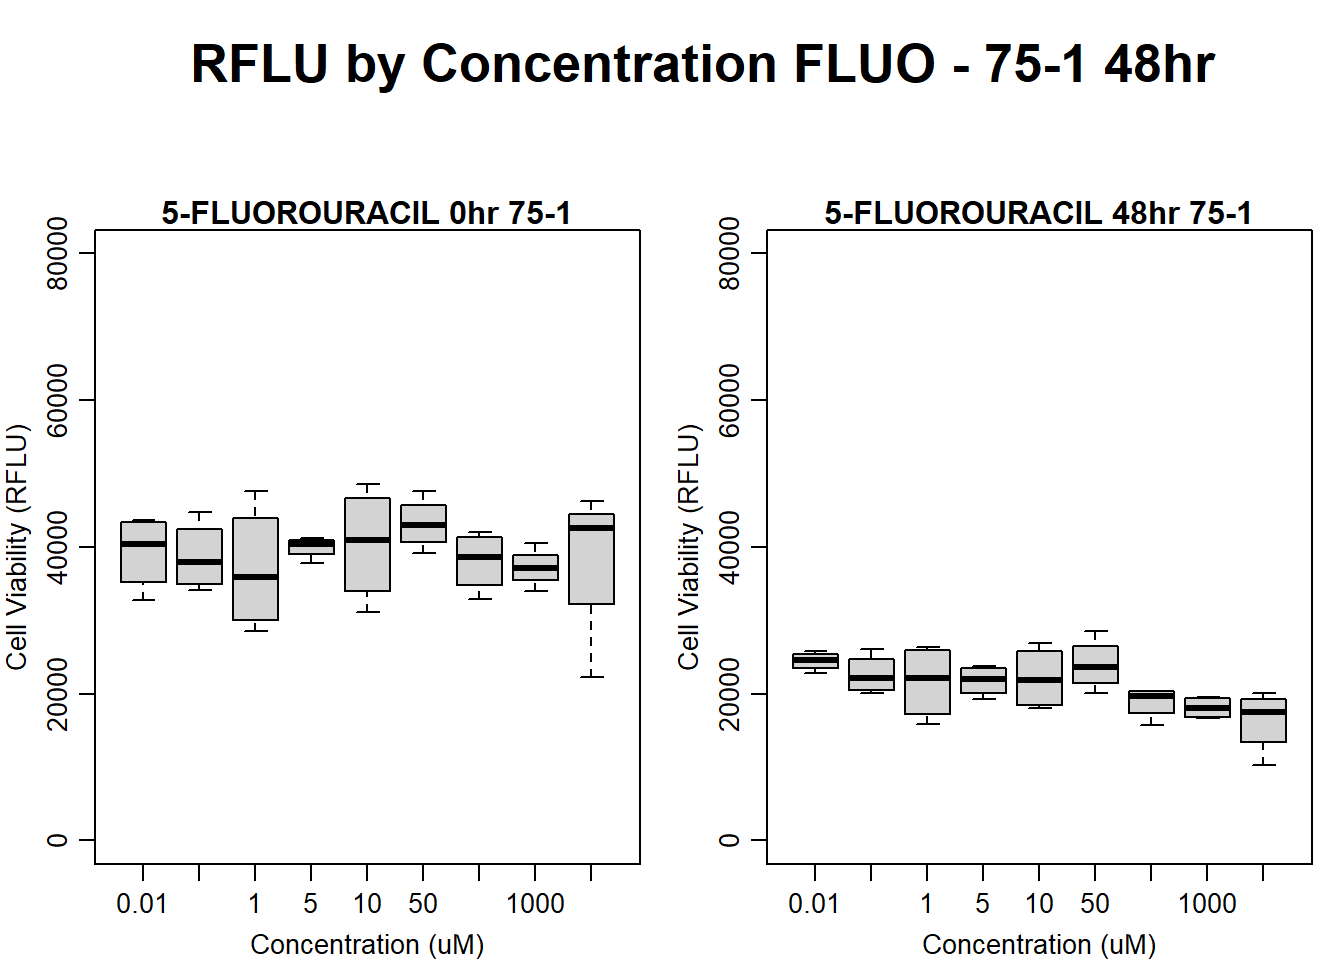
#FLUO 75-1 48HR
par(mar = c(3.0, 3.0, 1.2, 1), mgp = c(2, .7, 0))
layout(matrix(c(1, 2, 1, 3), nrow = 2, ncol = 2), heights = c(0.5, 2, 2, 2))
#layout.show(3)
plot.new()
text(0.5,0.5,"RFLU by Concentration FLUO - 75-1 48hr",cex = 2,font = 2)

boxplot(fluo48hr75$Ind1_75_In ~ fluo48hr75$Conc,
        ylim = c(0, 80000),
        ylab = "Cell Viability (RFLU)",
        xlab = "Concentration (uM)",
        main = "5-FLUOROURACIL 0hr 75-1"
)

boxplot(fluo48hr75$Ind1_75_Fin ~ fluo48hr75$Conc,
        ylim = c(0,80000),
        ylab = "Cell Viability (RFLU)",
        xlab = "Concentration (uM)",
        main = "5-FLUOROURACIL 48hr 75-1"
)
| Version | Author | Date |
|---|---|---|
| 109e14b | emmapfort | 2025-03-03 |
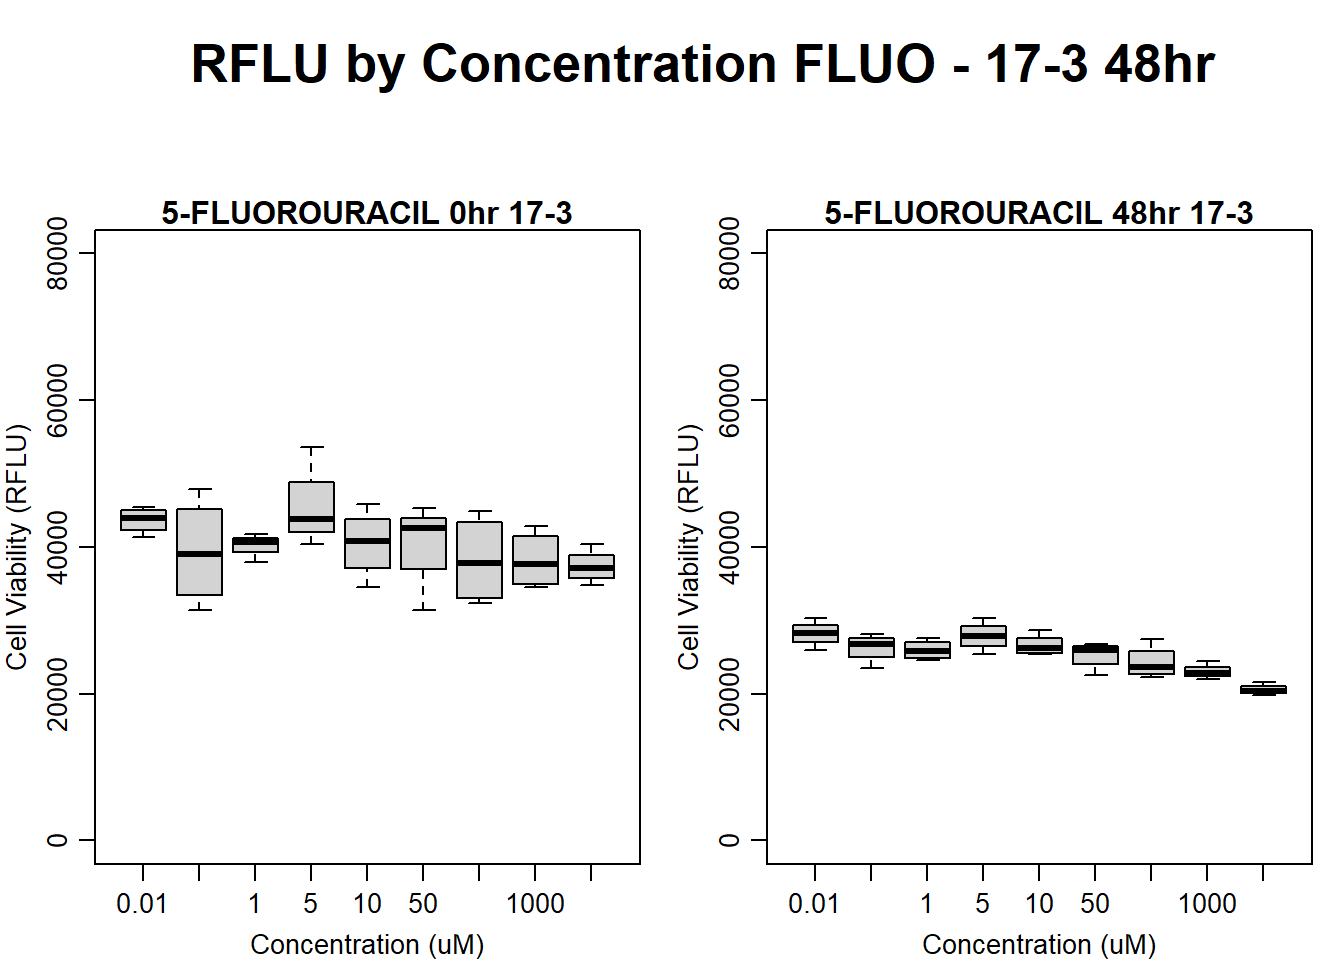
#FLUO 17-3 48HR
par(mar = c(3.0, 3.0, 1.2, 1), mgp = c(2, .7, 0))
layout(matrix(c(1, 2, 1, 3), nrow = 2, ncol = 2), heights = c(0.5, 2, 2, 2))
#layout.show(3)
plot.new()
text(0.5,0.5,"RFLU by Concentration FLUO - 17-3 48hr",cex = 2,font = 2)

boxplot(fluo48hr17$Ind3_17_In ~ fluo48hr17$Conc,
        ylim = c(0, 80000),
        ylab = "Cell Viability (RFLU)",
        xlab = "Concentration (uM)",
        main = "5-FLUOROURACIL 0hr 17-3"
)

boxplot(fluo48hr17$Ind3_17_Fin ~ fluo48hr17$Conc,
        ylim = c(0, 80000),
        ylab = "Cell Viability (RFLU)",
        xlab = "Concentration (uM)",
        main = "5-FLUOROURACIL 48hr 17-3"
)
| Version | Author | Date |
|---|---|---|
| 109e14b | emmapfort | 2025-03-03 |
#####DMSO samples#####
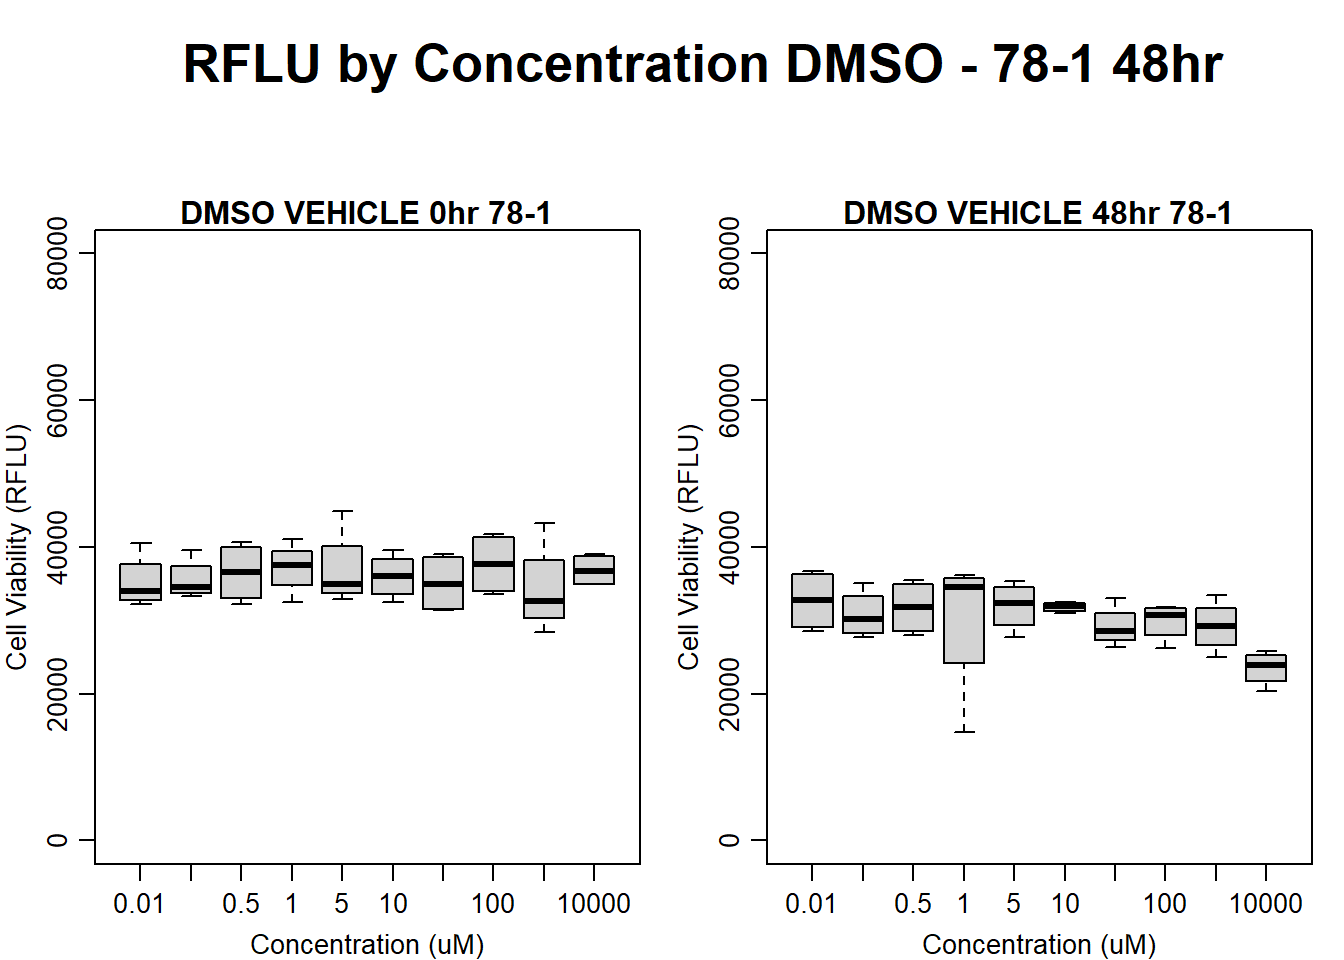
#DMSO 78-1 48HR
par(mar = c(3.0, 3.0, 1.2, 1), mgp = c(2, .7, 0))
layout(matrix(c(1, 2, 1, 3), nrow = 2, ncol = 2), heights = c(0.5, 2, 2, 2))
#layout.show(3)
plot.new()
text(0.5,0.5,"RFLU by Concentration DMSO - 78-1 48hr",cex = 2,font = 2)
boxplot(dmso48hr78$Ind2_78_In ~ dmso48hr78$Conc,
ylim = c(0, 80000),
ylab = "Cell Viability (RFLU)",
xlab = "Concentration (uM)",
main = "DMSO VEHICLE 0hr 78-1"
)
boxplot(dmso48hr78$Ind2_78_Fin ~ dmso48hr78$Conc,
ylim = c(0,80000),
ylab = "Cell Viability (RFLU)",
xlab = "Concentration (uM)",
main = "DMSO VEHICLE 48hr 78-1"
)
| Version | Author | Date |
|---|---|---|
| 109e14b | emmapfort | 2025-03-03 |
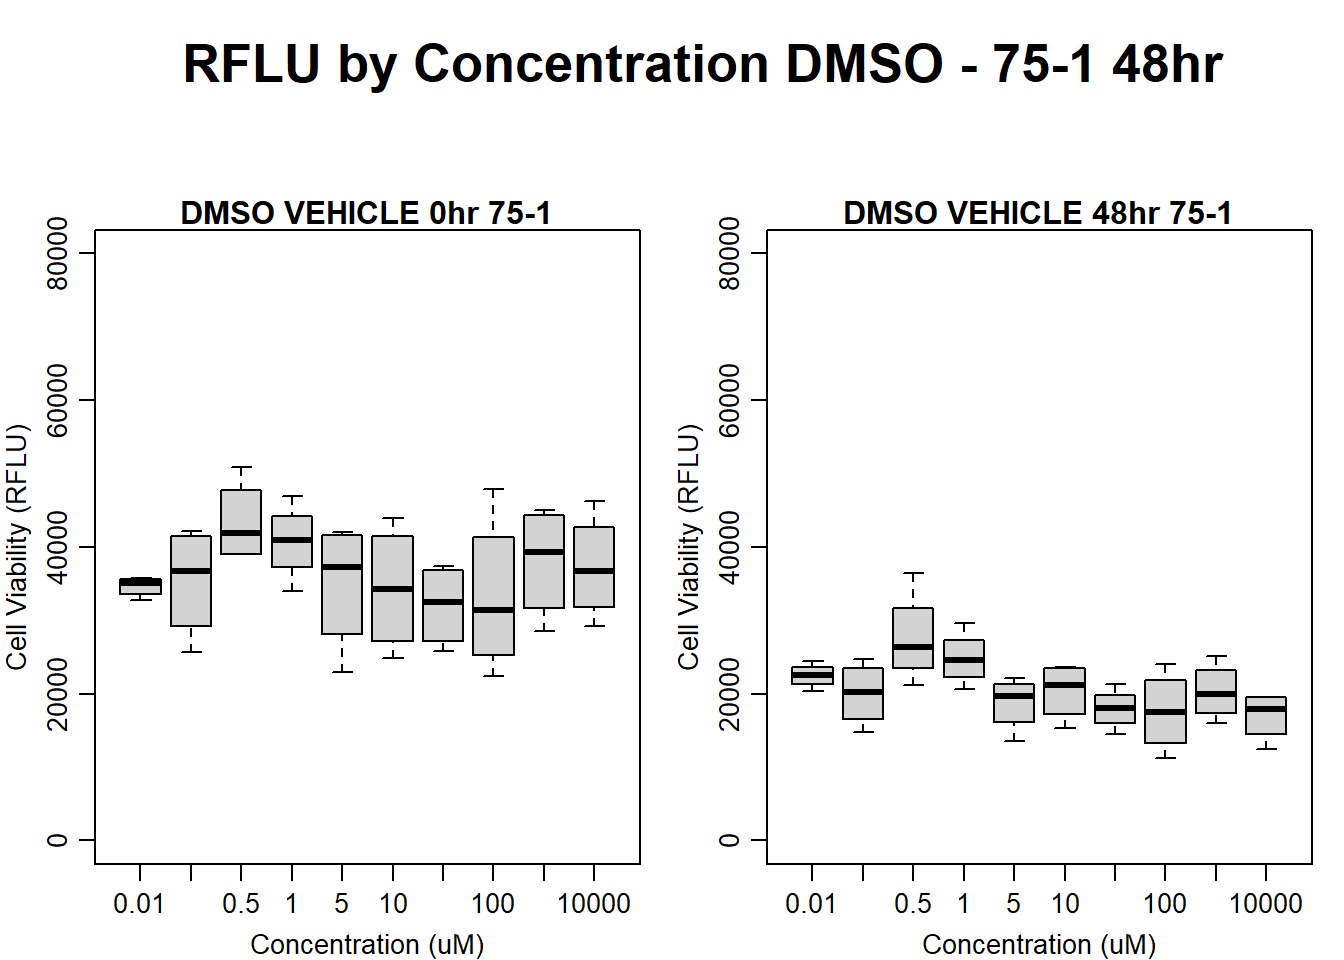
#DMSO 75-1 48HR
par(mar = c(3.0, 3.0, 1.2, 1), mgp = c(2, .7, 0))
layout(matrix(c(1, 2, 1, 3), nrow = 2, ncol = 2), heights = c(0.5, 2, 2, 2))
#layout.show(3)
plot.new()
text(0.5,0.5,"RFLU by Concentration DMSO - 75-1 48hr",cex = 2,font = 2)

boxplot(dmso48hr75$Ind1_75_In ~ dmso48hr75$Conc,
        ylim = c(0, 80000),
        ylab = "Cell Viability (RFLU)",
        xlab = "Concentration (uM)",
        main = "DMSO VEHICLE 0hr 75-1"
)

boxplot(dmso48hr75$Ind1_75_Fin ~ dmso48hr75$Conc,
        ylim = c(0,80000),
        ylab = "Cell Viability (RFLU)",
        xlab = "Concentration (uM)",
        main = "DMSO VEHICLE 48hr 75-1"
)
| Version | Author | Date |
|---|---|---|
| 109e14b | emmapfort | 2025-03-03 |
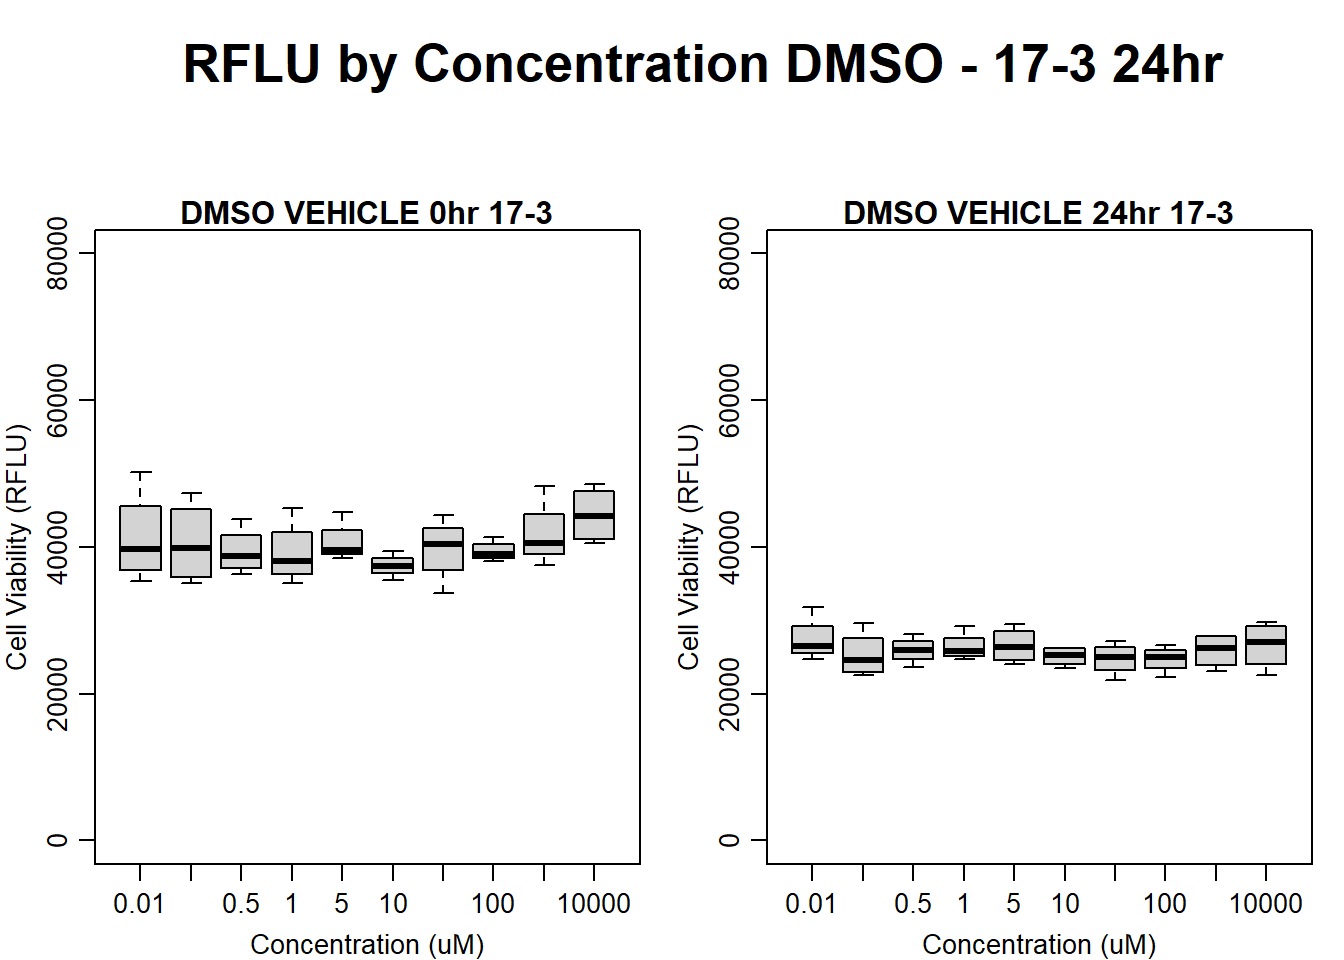
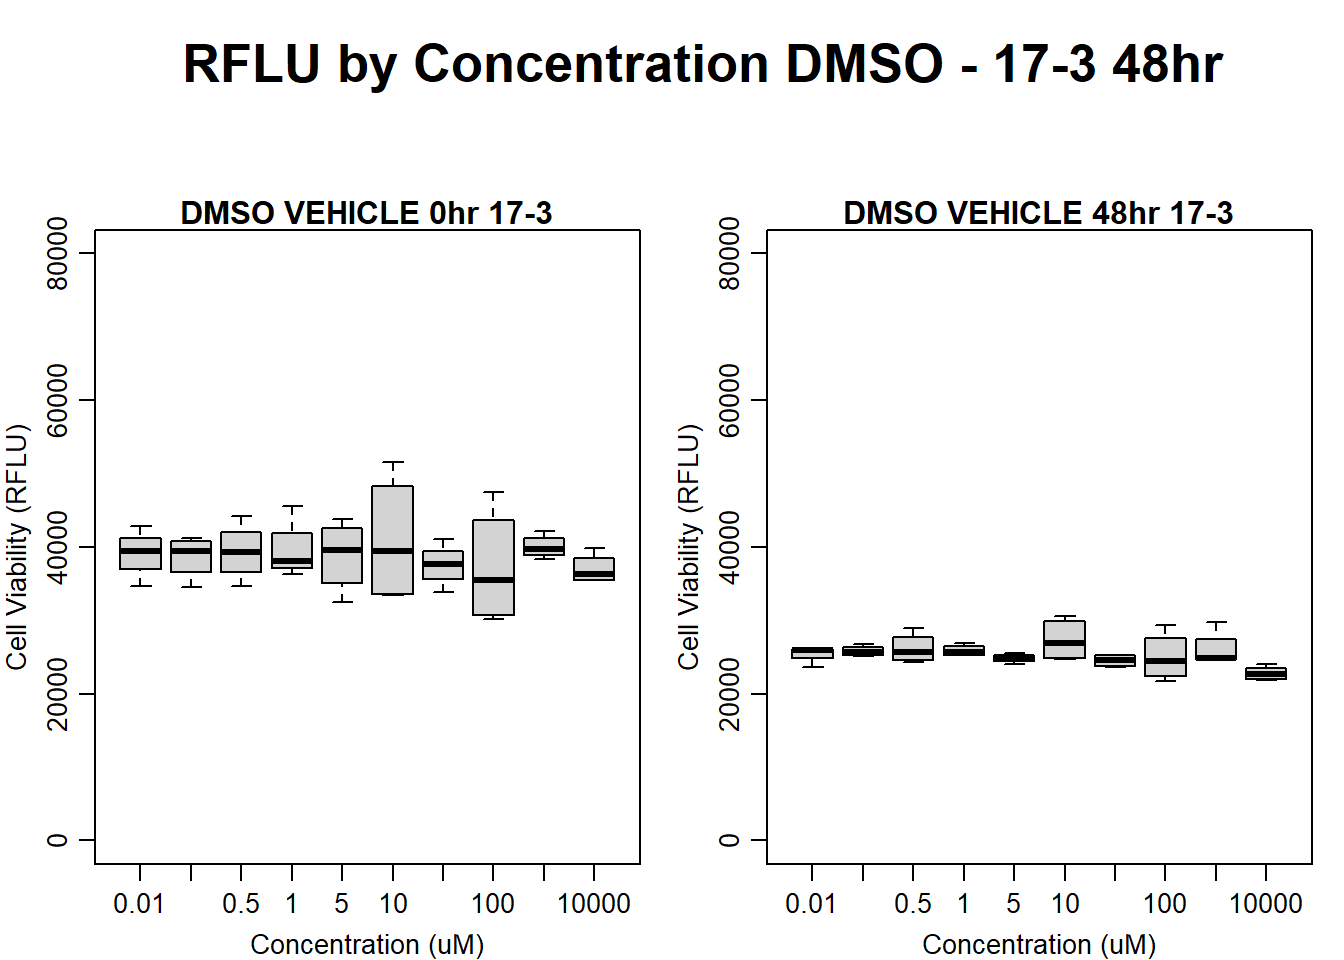
#DMSO 17-3 48HR
par(mar = c(3.0, 3.0, 1.2, 1), mgp = c(2, .7, 0))
layout(matrix(c(1, 2, 1, 3), nrow = 2, ncol = 2), heights = c(0.5, 2, 2, 2))
#layout.show(3)
plot.new()
text(0.5,0.5,"RFLU by Concentration DMSO - 17-3 48hr",cex = 2,font = 2)

boxplot(dmso48hr17$Ind3_17_In ~ dmso48hr17$Conc,
        ylim = c(0, 80000),
        ylab = "Cell Viability (RFLU)",
        xlab = "Concentration (uM)",
        main = "DMSO VEHICLE 0hr 17-3"
)

boxplot(dmso48hr17$Ind3_17_Fin ~ dmso48hr17$Conc,
        ylim = c(0,80000),
        ylab = "Cell Viability (RFLU)",
        xlab = "Concentration (uM)",
        main = "DMSO VEHICLE 48hr 17-3"
)
| Version | Author | Date |
|---|---|---|
| 109e14b | emmapfort | 2025-03-03 |
#####DOX Samples#####
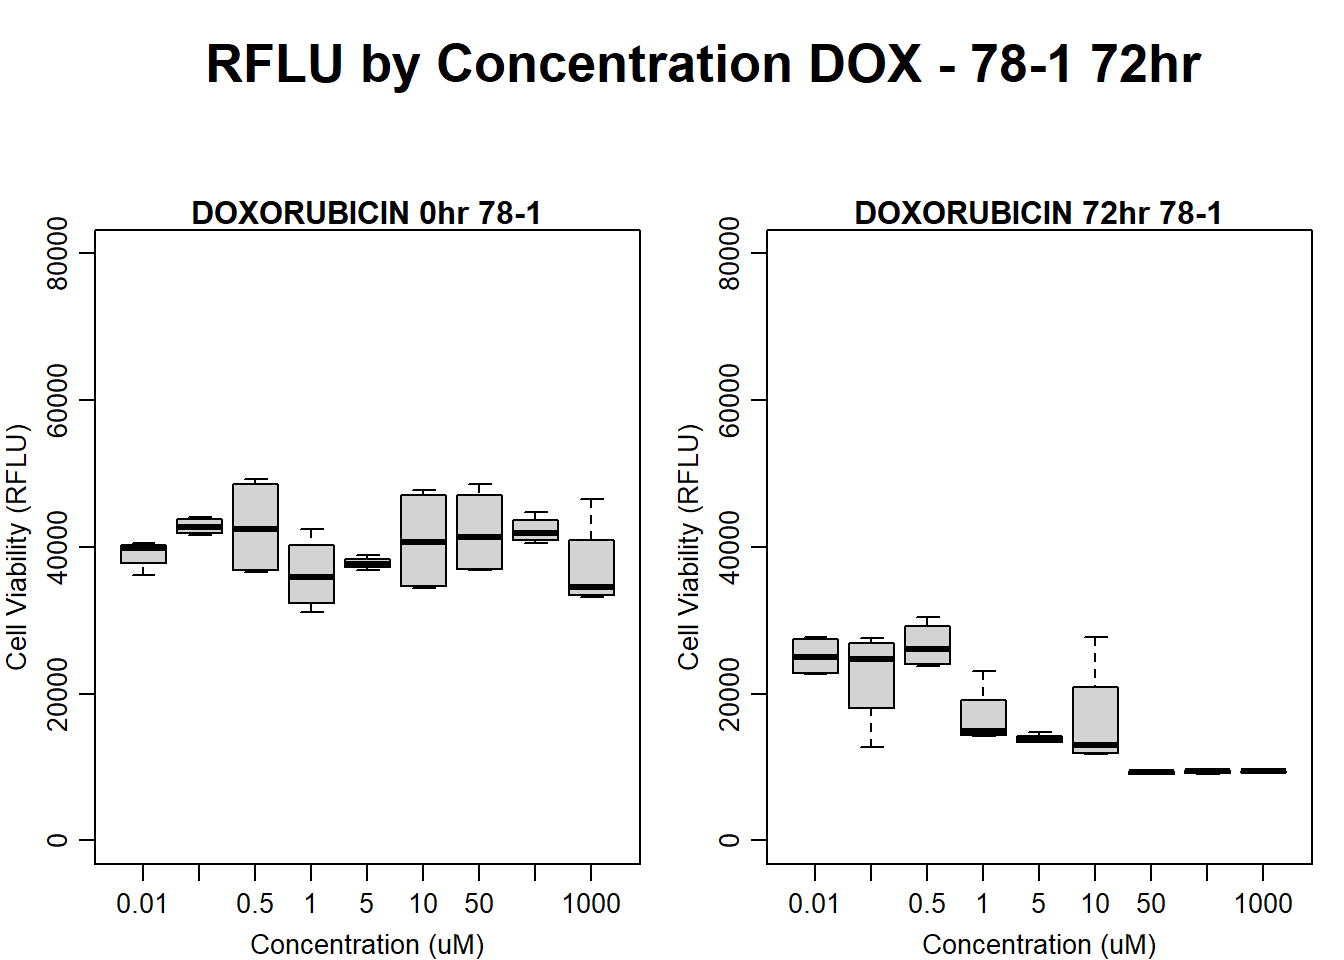
#DOX 78-1 72HR
par(mar = c(3.0, 3.0, 1.2, 1), mgp = c(2, .7, 0))
layout(matrix(c(1, 2, 1, 3), nrow = 2, ncol = 2), heights = c(0.5, 2, 2, 2))
#layout.show(3)
plot.new()
text(0.5,0.5,"RFLU by Concentration DOX - 78-1 72hr",cex = 2,font = 2)
boxplot(dox72hr78$Ind2_78_In ~ dox72hr78$Conc,
ylim = c(0, 80000),
ylab = "Cell Viability (RFLU)",
xlab = "Concentration (uM)",
main = "DOXORUBICIN 0hr 78-1"
)
boxplot(dox72hr78$Ind2_78_Fin ~ dox72hr78$Conc,
ylim = c(0,80000),
ylab = "Cell Viability (RFLU)",
xlab = "Concentration (uM)",
main = "DOXORUBICIN 72hr 78-1"
)
| Version | Author | Date |
|---|---|---|
| 109e14b | emmapfort | 2025-03-03 |
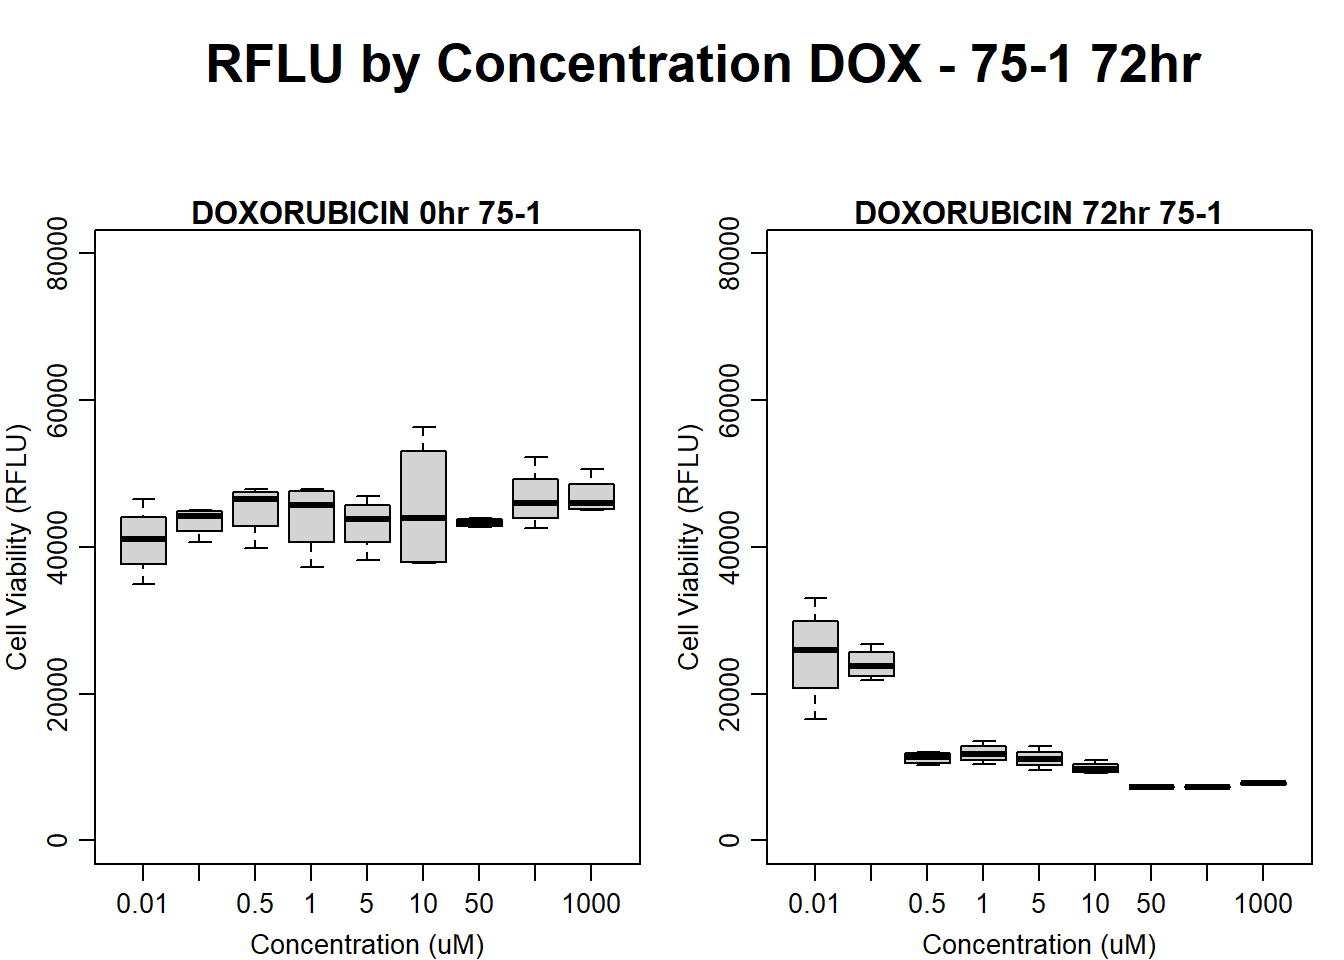
#DOX 75-1 72HR
par(mar = c(3.0, 3.0, 1.2, 1), mgp = c(2, .7, 0))
layout(matrix(c(1, 2, 1, 3), nrow = 2, ncol = 2), heights = c(0.5, 2, 2, 2))
#layout.show(3)
plot.new()
text(0.5,0.5,"RFLU by Concentration DOX - 75-1 72hr",cex = 2,font = 2)

boxplot(dox72hr75$Ind1_75_In ~ dox72hr75$Conc,
        ylim = c(0, 80000),
        ylab = "Cell Viability (RFLU)",
        xlab = "Concentration (uM)",
        main = "DOXORUBICIN 0hr 75-1"
)

boxplot(dox72hr75$Ind1_75_Fin ~ dox72hr75$Conc,
        ylim = c(0,80000),
        ylab = "Cell Viability (RFLU)",
        xlab = "Concentration (uM)",
        main = "DOXORUBICIN 72hr 75-1"
)
| Version | Author | Date |
|---|---|---|
| 109e14b | emmapfort | 2025-03-03 |
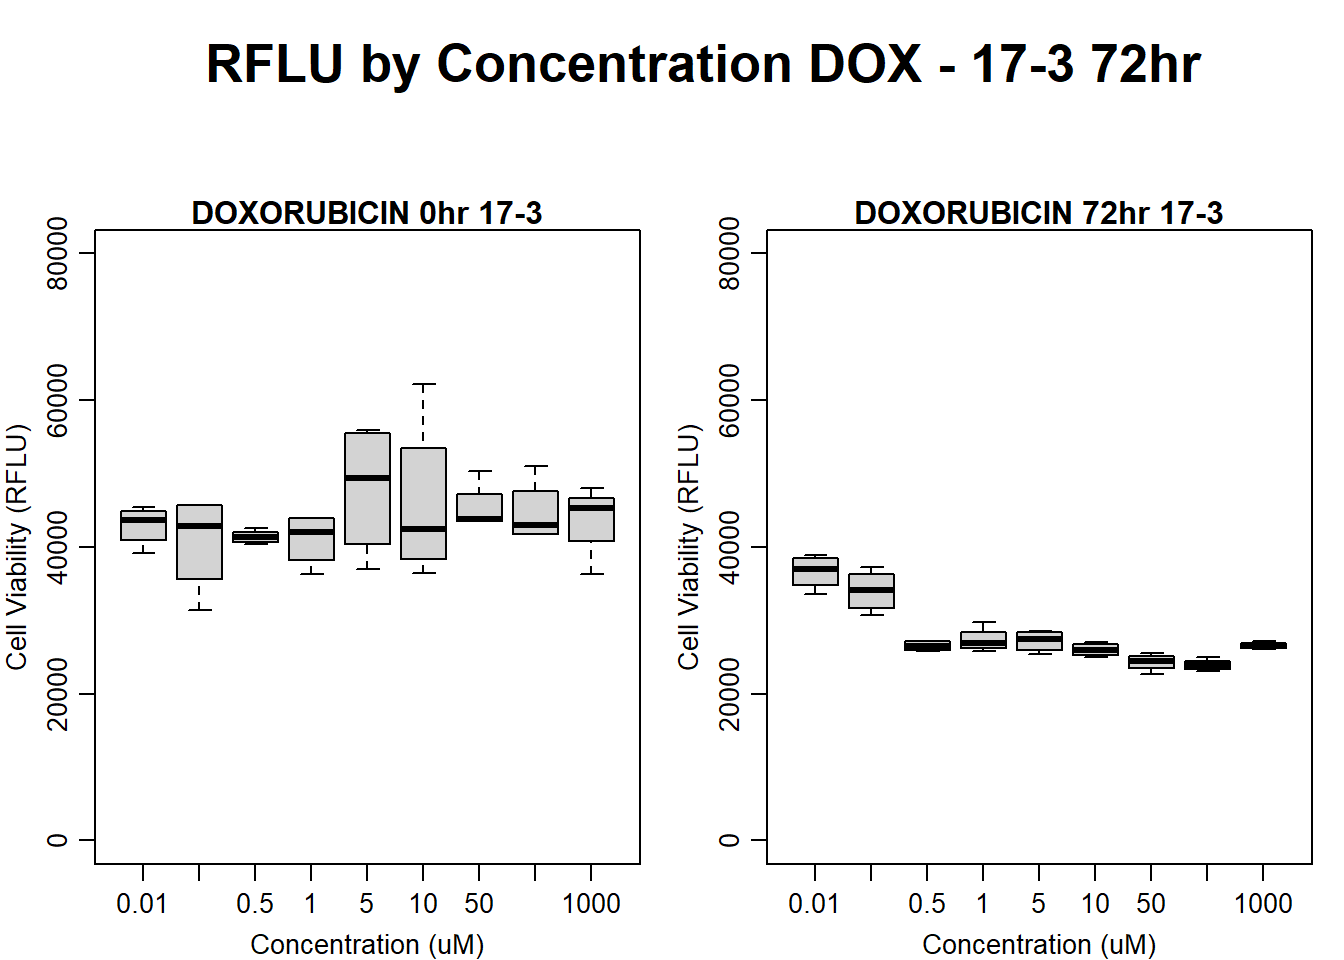
#DOX 17-3 72HR
par(mar = c(3.0, 3.0, 1.2, 1), mgp = c(2, .7, 0))
layout(matrix(c(1, 2, 1, 3), nrow = 2, ncol = 2), heights = c(0.5, 2, 2, 2))
#layout.show(3)
plot.new()
text(0.5,0.5,"RFLU by Concentration DOX - 17-3 72hr",cex = 2,font = 2)

boxplot(dox72hr17$Ind3_17_In ~ dox72hr17$Conc,
        ylim = c(0, 80000),
        ylab = "Cell Viability (RFLU)",
        xlab = "Concentration (uM)",
        main = "DOXORUBICIN 0hr 17-3"
)

boxplot(dox72hr17$Ind3_17_Fin ~ dox72hr17$Conc,
        ylim = c(0,80000),
        ylab = "Cell Viability (RFLU)",
        xlab = "Concentration (uM)",
        main = "DOXORUBICIN 72hr 17-3"
)
| Version | Author | Date |
|---|---|---|
| 109e14b | emmapfort | 2025-03-03 |
#####FLUO samples#####
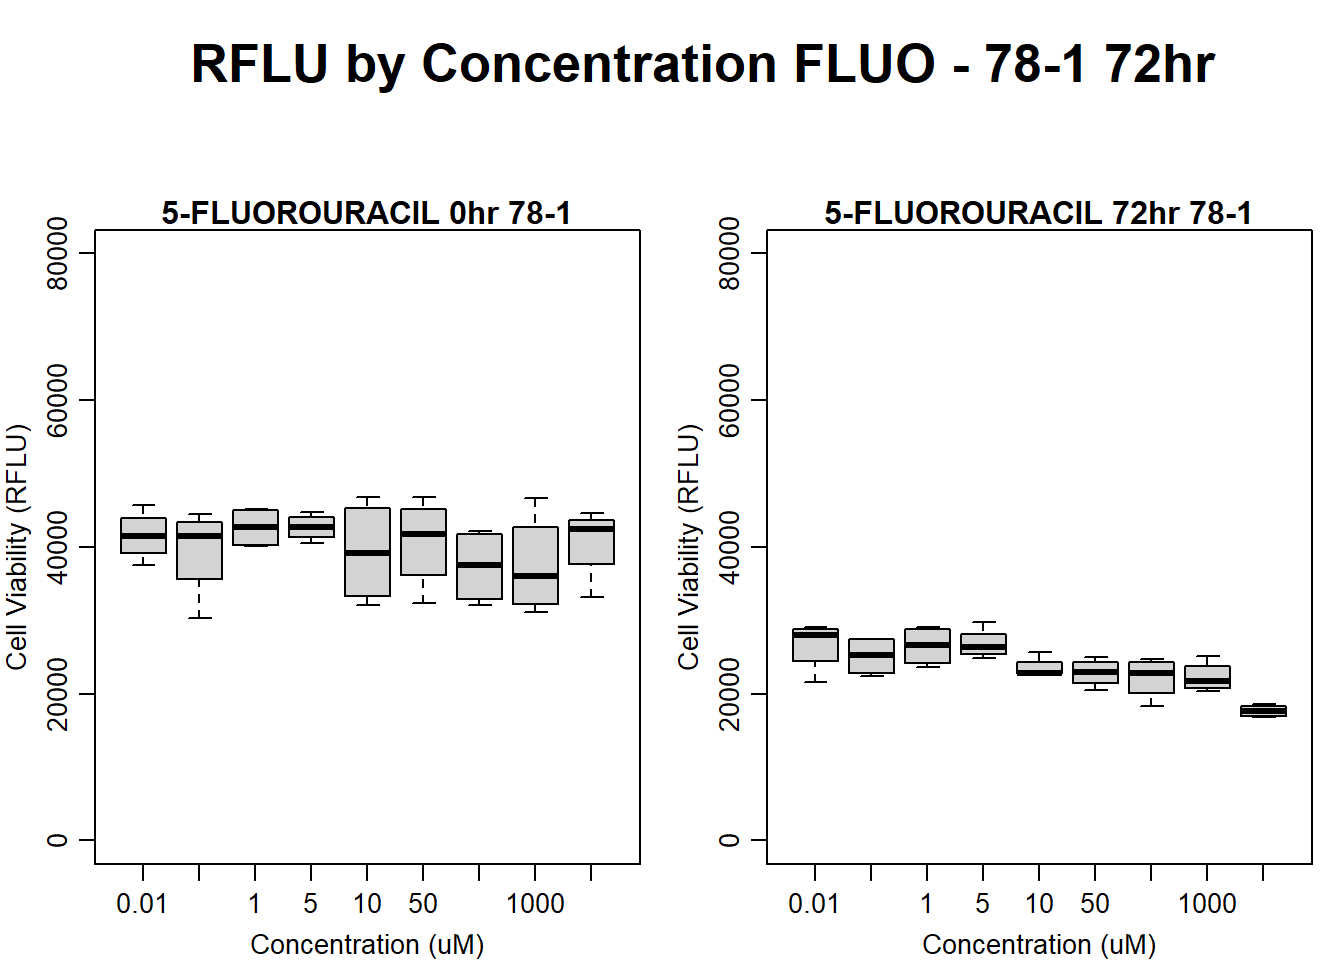
#FLUO 78-1 72HR
par(mar = c(3.0, 3.0, 1.2, 1), mgp = c(2, .7, 0))
layout(matrix(c(1, 2, 1, 3), nrow = 2, ncol = 2), heights = c(0.5, 2, 2, 2))
#layout.show(3)
plot.new()
text(0.5,0.5,"RFLU by Concentration FLUO - 78-1 72hr",cex = 2,font = 2)
boxplot(fluo72hr78$Ind2_78_In ~ fluo72hr78$Conc,
ylim = c(0, 80000),
ylab = "Cell Viability (RFLU)",
xlab = "Concentration (uM)",
main = "5-FLUOROURACIL 0hr 78-1"
)
boxplot(fluo72hr78$Ind2_78_Fin ~ fluo72hr78$Conc,
ylim = c(0,80000),
ylab = "Cell Viability (RFLU)",
xlab = "Concentration (uM)",
main = "5-FLUOROURACIL 72hr 78-1"
)
| Version | Author | Date |
|---|---|---|
| 109e14b | emmapfort | 2025-03-03 |
#FLUO 75-1 72HR
par(mar = c(3.0, 3.0, 1.2, 1), mgp = c(2, .7, 0))
layout(matrix(c(1, 2, 1, 3), nrow = 2, ncol = 2), heights = c(0.5, 2, 2, 2))
#layout.show(3)
plot.new()
text(0.5,0.5,"RFLU by Concentration FLUO - 75-1 72hr",cex = 2,font = 2)

boxplot(fluo72hr75$Ind1_75_In ~ fluo72hr75$Conc,
        ylim = c(0, 80000),
        ylab = "Cell Viability (RFLU)",
        xlab = "Concentration (uM)",
        main = "5-FLUOROURACIL 0hr 75-1"
)

boxplot(fluo72hr75$Ind1_75_Fin ~ fluo72hr75$Conc,
        ylim = c(0,80000),
        ylab = "Cell Viability (RFLU)",
        xlab = "Concentration (uM)",
        main = "5-FLUOROURACIL 72hr 75-1"
)
| Version | Author | Date |
|---|---|---|
| 109e14b | emmapfort | 2025-03-03 |
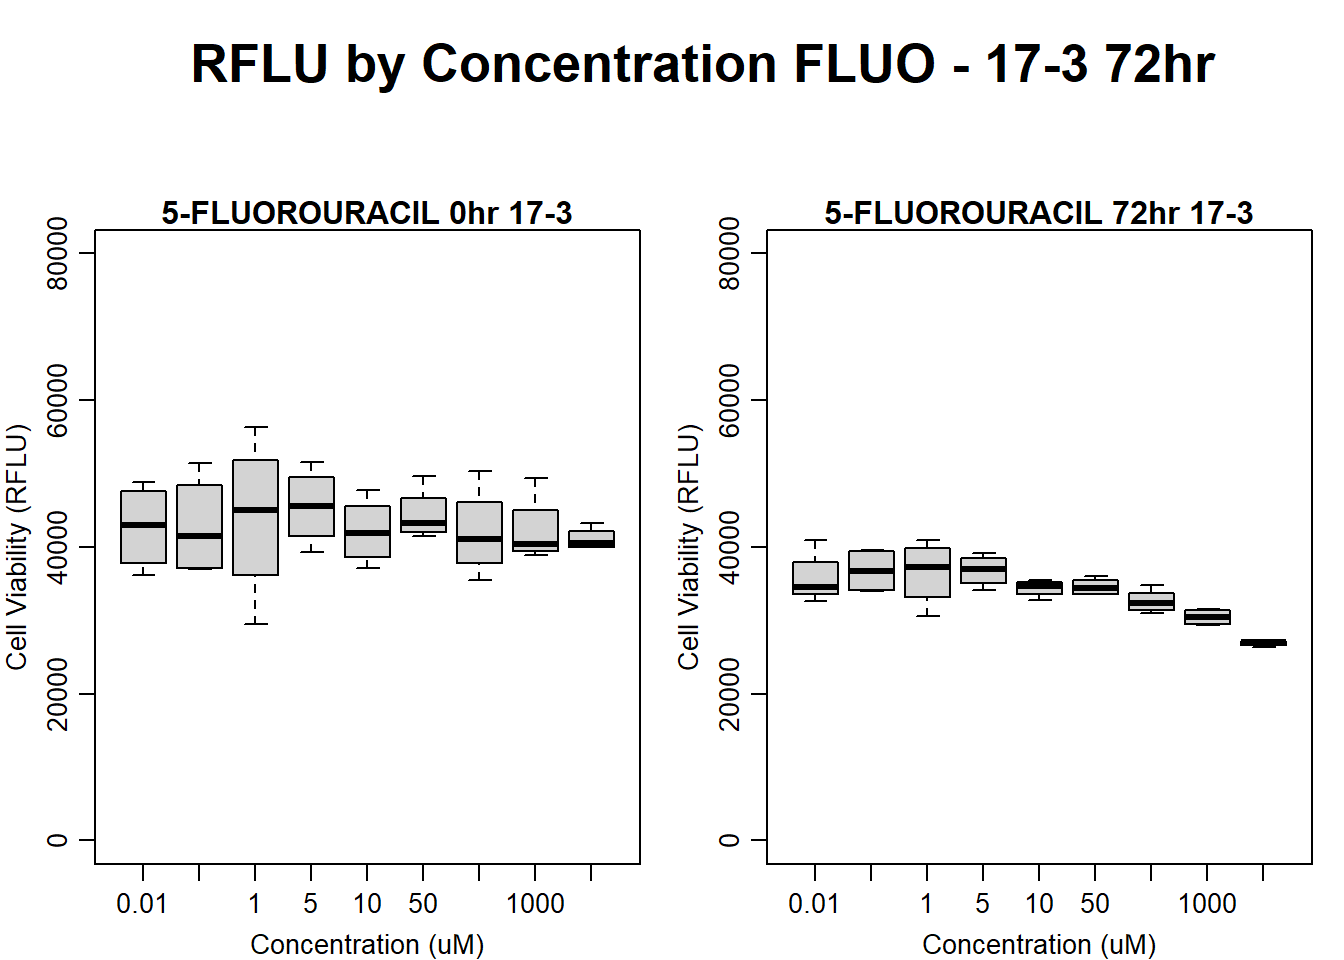
#FLUO 17-3 72HR
par(mar = c(3.0, 3.0, 1.2, 1), mgp = c(2, .7, 0))
layout(matrix(c(1, 2, 1, 3), nrow = 2, ncol = 2), heights = c(0.5, 2, 2, 2))
#layout.show(3)
plot.new()
text(0.5,0.5,"RFLU by Concentration FLUO - 17-3 72hr",cex = 2,font = 2)

boxplot(fluo72hr17$Ind3_17_In ~ fluo72hr17$Conc,
        ylim = c(0, 80000),
        ylab = "Cell Viability (RFLU)",
        xlab = "Concentration (uM)",
        main = "5-FLUOROURACIL 0hr 17-3"
)

boxplot(fluo72hr17$Ind3_17_Fin ~ fluo72hr17$Conc,
        ylim = c(0, 80000),
        ylab = "Cell Viability (RFLU)",
        xlab = "Concentration (uM)",
        main = "5-FLUOROURACIL 72hr 17-3"
)
| Version | Author | Date |
|---|---|---|
| 109e14b | emmapfort | 2025-03-03 |
#####DMSO samples#####
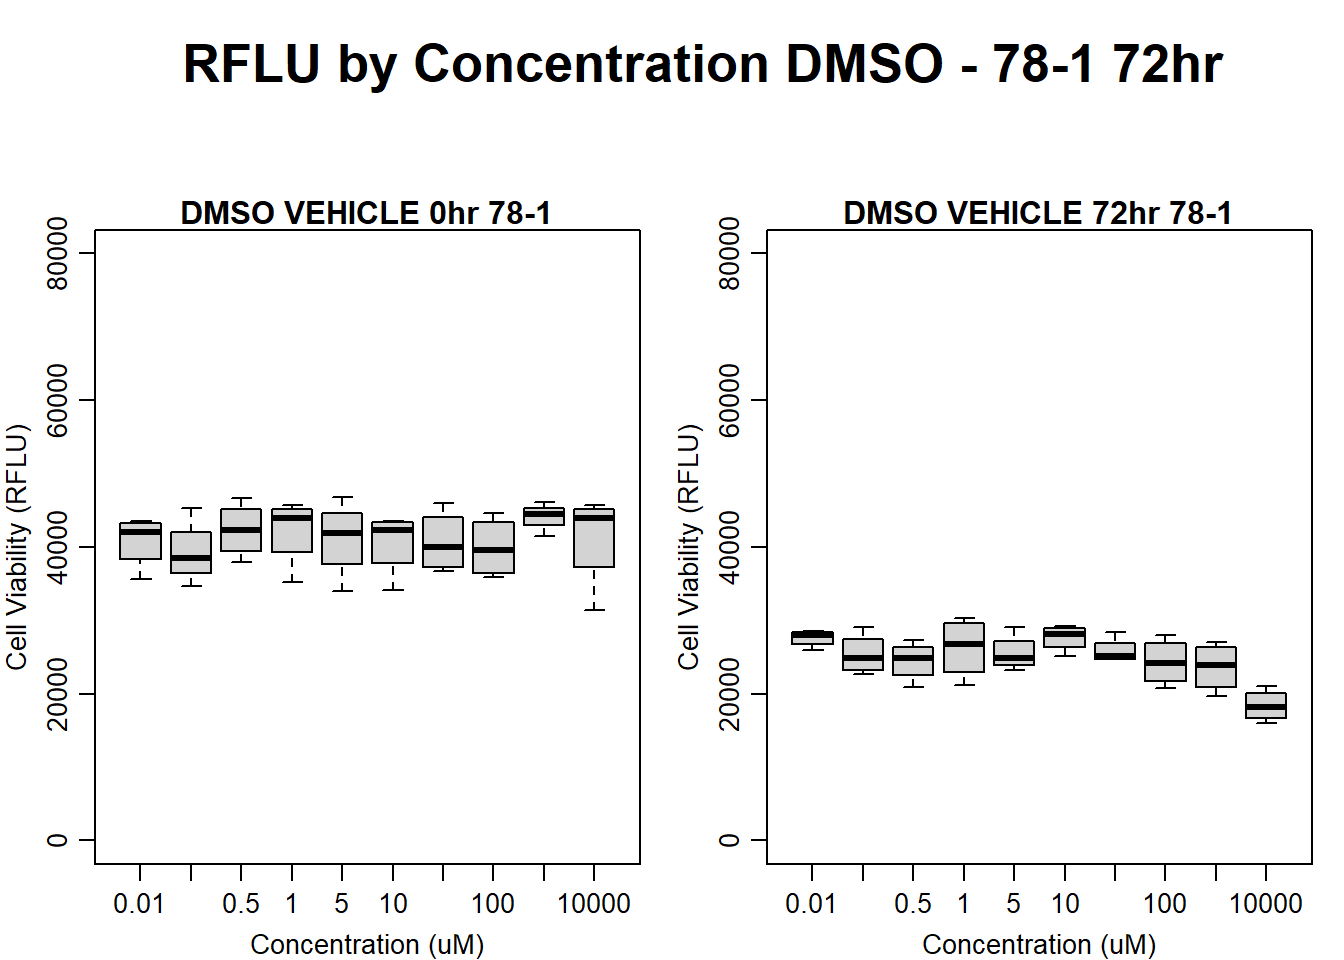
#DMSO 78-1 72HR
par(mar = c(3.0, 3.0, 1.2, 1), mgp = c(2, .7, 0))
layout(matrix(c(1, 2, 1, 3), nrow = 2, ncol = 2), heights = c(0.5, 2, 2, 2))
#layout.show(3)
plot.new()
text(0.5,0.5,"RFLU by Concentration DMSO - 78-1 72hr",cex = 2,font = 2)
boxplot(dmso72hr78$Ind2_78_In ~ dmso72hr78$Conc,
ylim = c(0, 80000),
ylab = "Cell Viability (RFLU)",
xlab = "Concentration (uM)",
main = "DMSO VEHICLE 0hr 78-1"
)
boxplot(dmso72hr78$Ind2_78_Fin ~ dmso72hr78$Conc,
ylim = c(0,80000),
ylab = "Cell Viability (RFLU)",
xlab = "Concentration (uM)",
main = "DMSO VEHICLE 72hr 78-1"
)
| Version | Author | Date |
|---|---|---|
| 109e14b | emmapfort | 2025-03-03 |
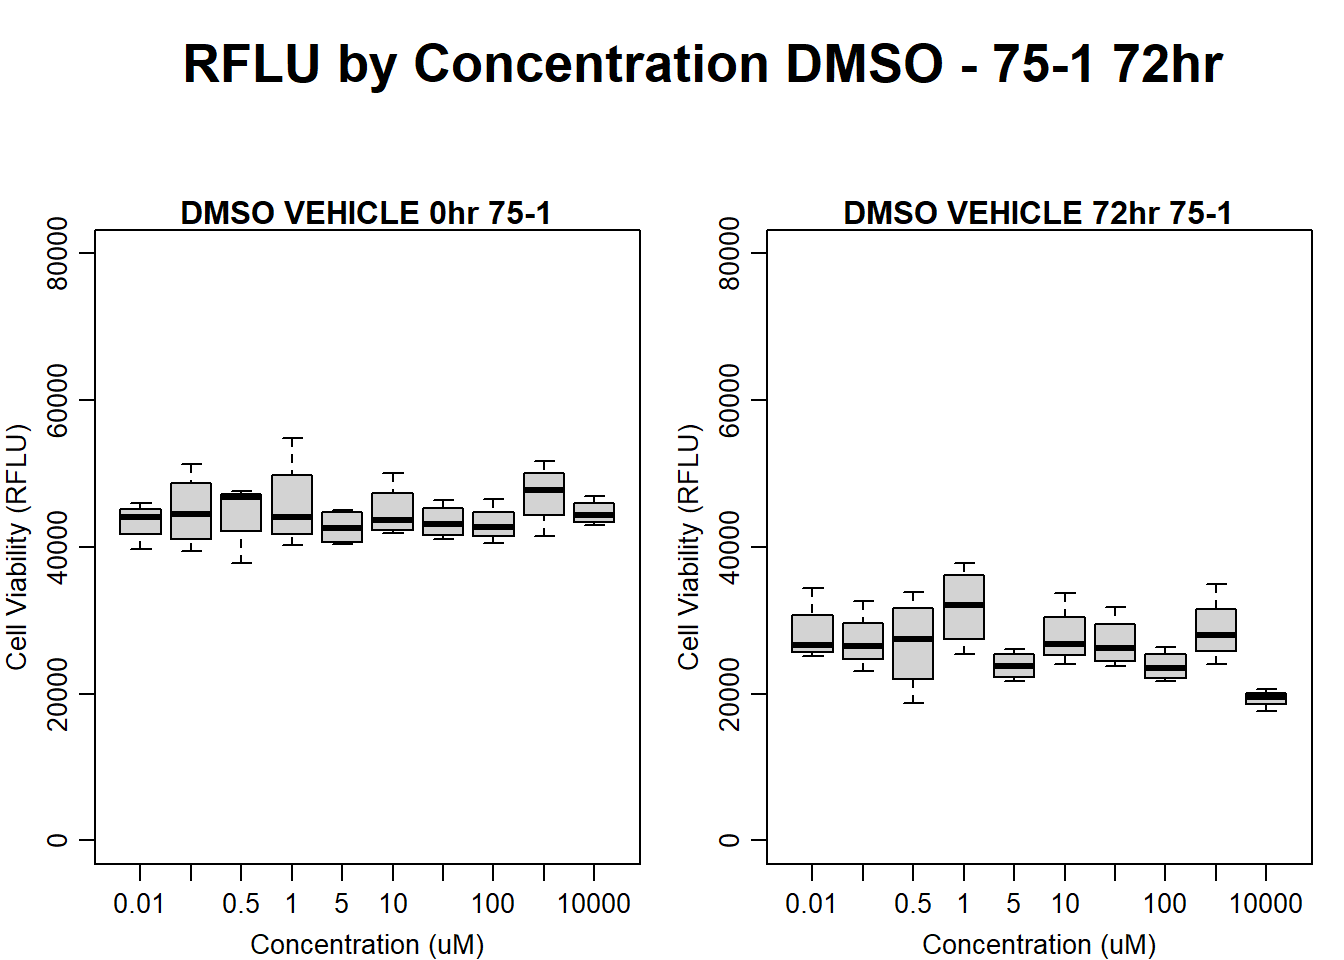
#DMSO 75-1 72HR
par(mar = c(3.0, 3.0, 1.2, 1), mgp = c(2, .7, 0))
layout(matrix(c(1, 2, 1, 3), nrow = 2, ncol = 2), heights = c(0.5, 2, 2, 2))
#layout.show(3)
plot.new()
text(0.5,0.5,"RFLU by Concentration DMSO - 75-1 72hr",cex = 2,font = 2)

boxplot(dmso72hr75$Ind1_75_In ~ dmso72hr75$Conc,
        ylim = c(0, 80000),
        ylab = "Cell Viability (RFLU)",
        xlab = "Concentration (uM)",
        main = "DMSO VEHICLE 0hr 75-1"
)

boxplot(dmso72hr75$Ind1_75_Fin ~ dmso72hr75$Conc,
        ylim = c(0,80000),
        ylab = "Cell Viability (RFLU)",
        xlab = "Concentration (uM)",
        main = "DMSO VEHICLE 72hr 75-1"
)
| Version | Author | Date |
|---|---|---|
| 109e14b | emmapfort | 2025-03-03 |
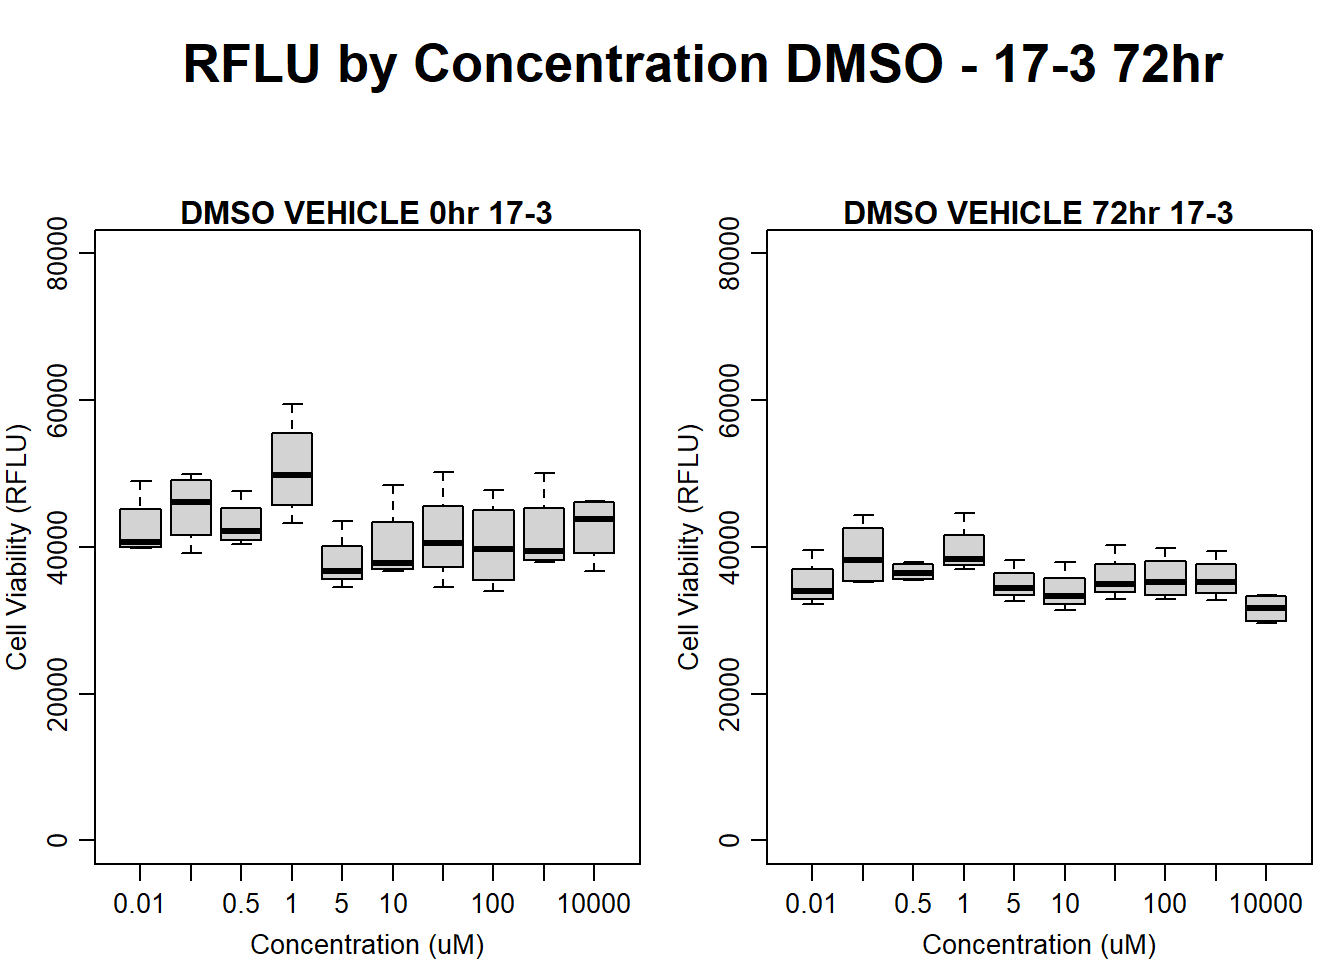
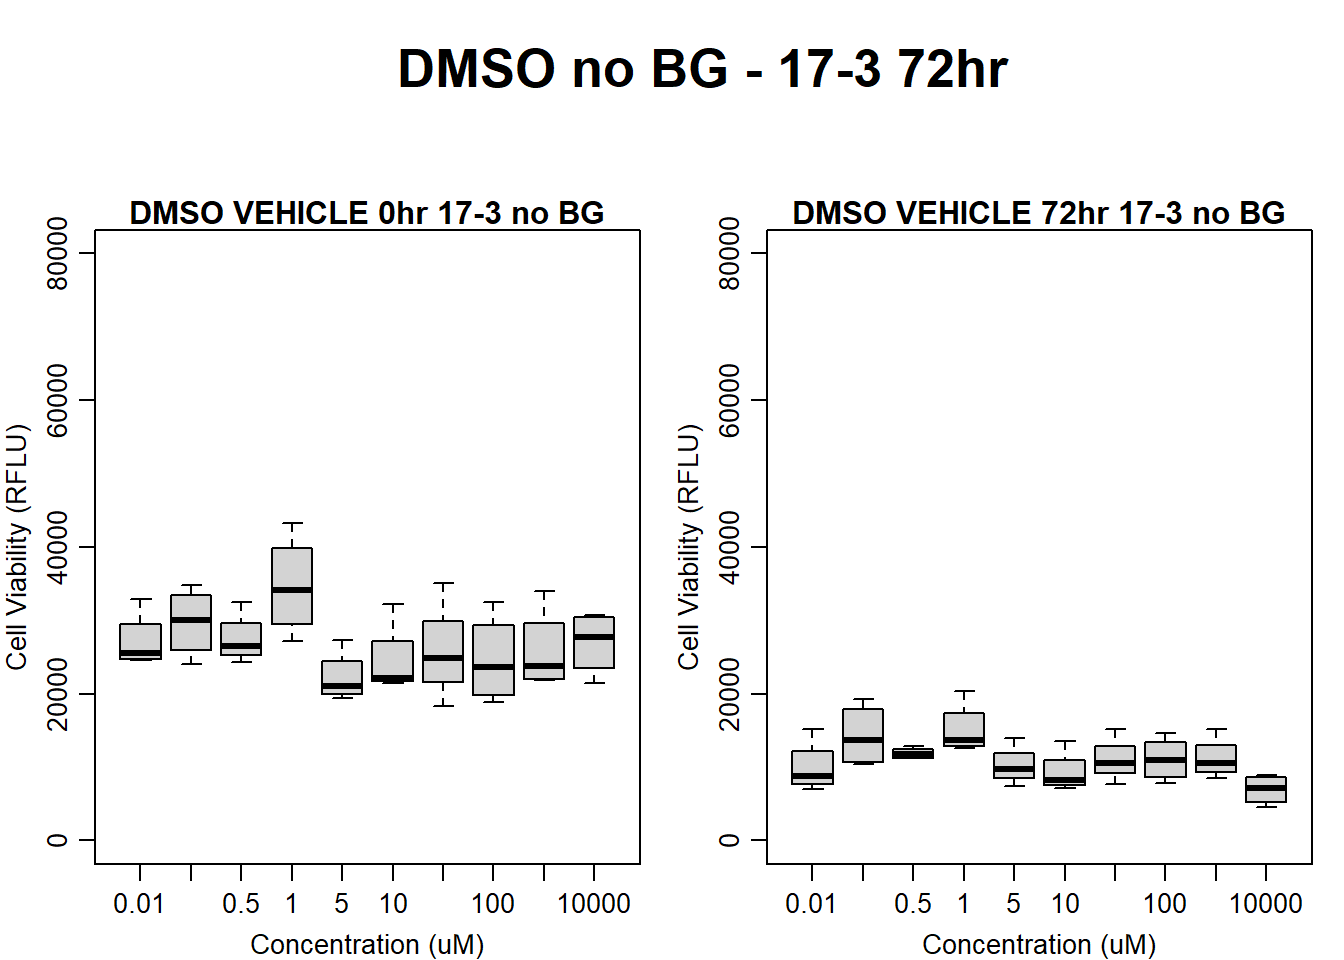
#DMSO 17-3 72HR
par(mar = c(3.0, 3.0, 1.2, 1), mgp = c(2, .7, 0))
layout(matrix(c(1, 2, 1, 3), nrow = 2, ncol = 2), heights = c(0.5, 2, 2, 2))
#layout.show(3)
plot.new()
text(0.5,0.5,"RFLU by Concentration DMSO - 17-3 72hr",cex = 2,font = 2)

boxplot(dmso72hr17$Ind3_17_In ~ dmso72hr17$Conc,
        ylim = c(0, 80000),
        ylab = "Cell Viability (RFLU)",
        xlab = "Concentration (uM)",
        main = "DMSO VEHICLE 0hr 17-3"
)

boxplot(dmso72hr17$Ind3_17_Fin ~ dmso72hr17$Conc,
        ylim = c(0,80000),
        ylab = "Cell Viability (RFLU)",
        xlab = "Concentration (uM)",
        main = "DMSO VEHICLE 72hr 17-3"
)
| Version | Author | Date |
|---|---|---|
| 109e14b | emmapfort | 2025-03-03 |
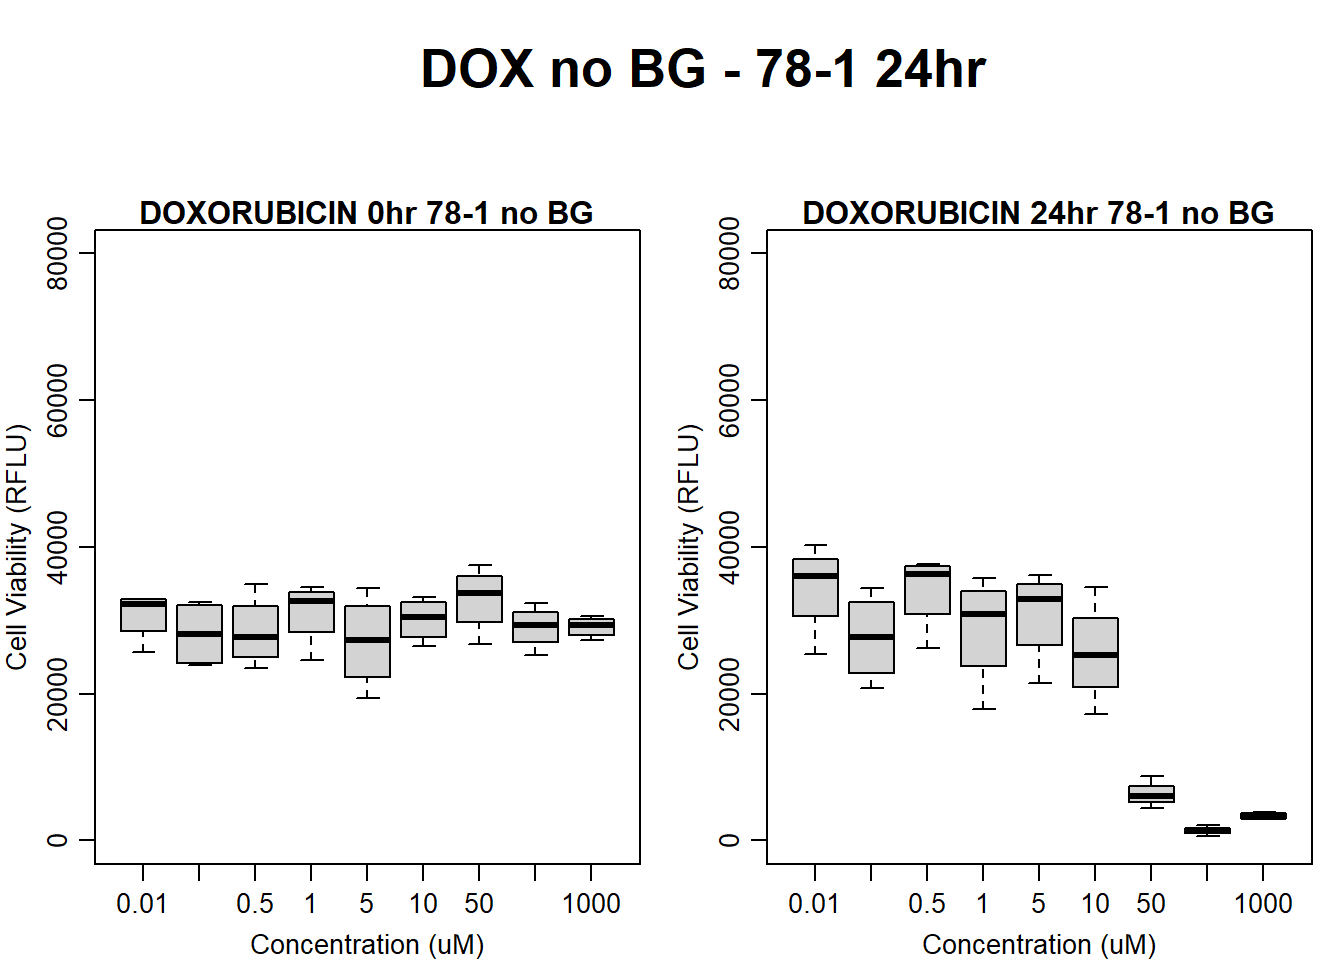
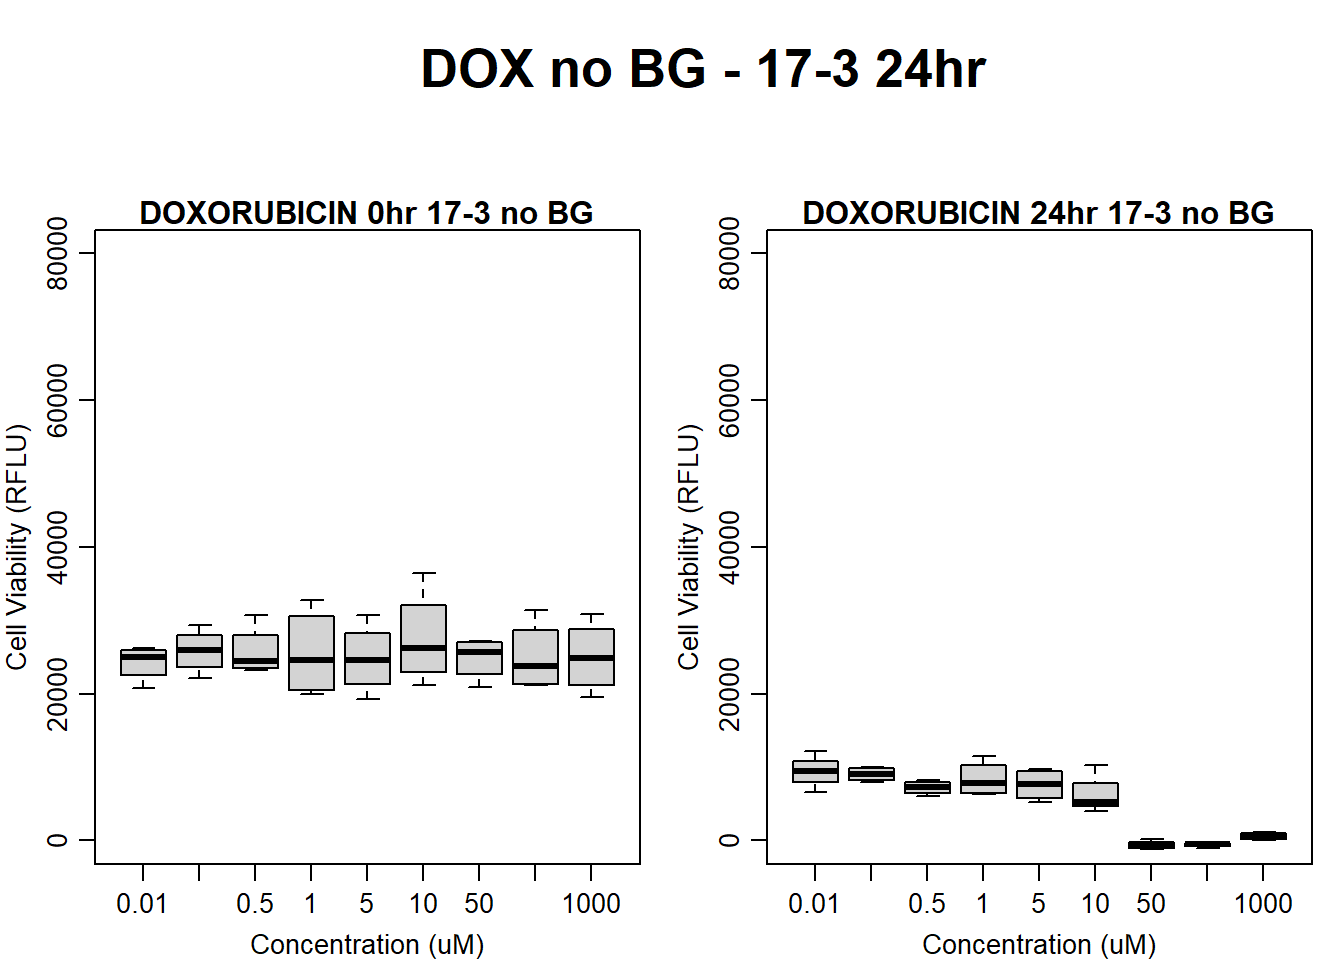
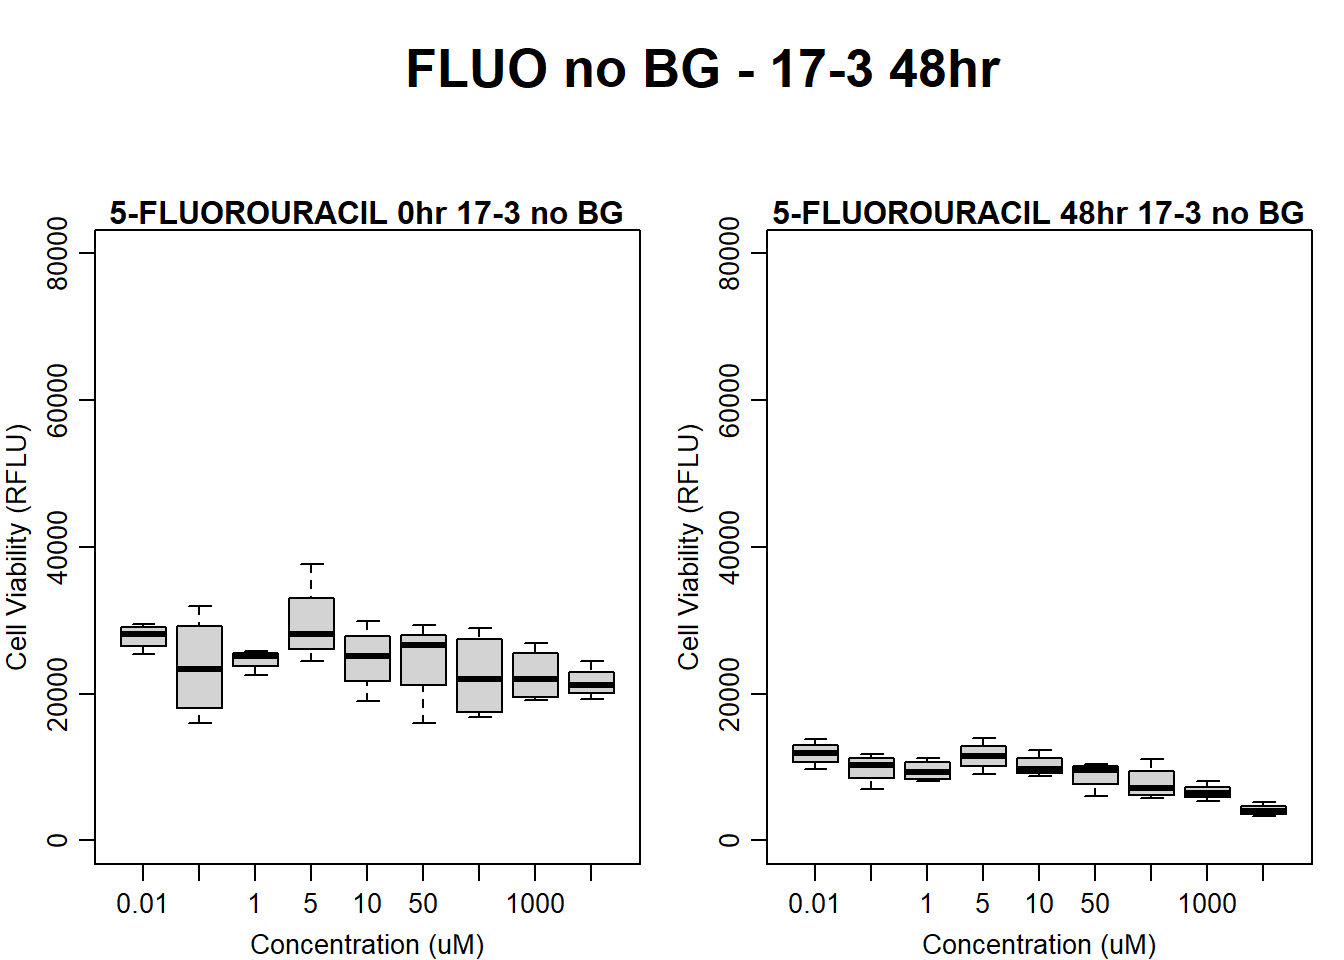
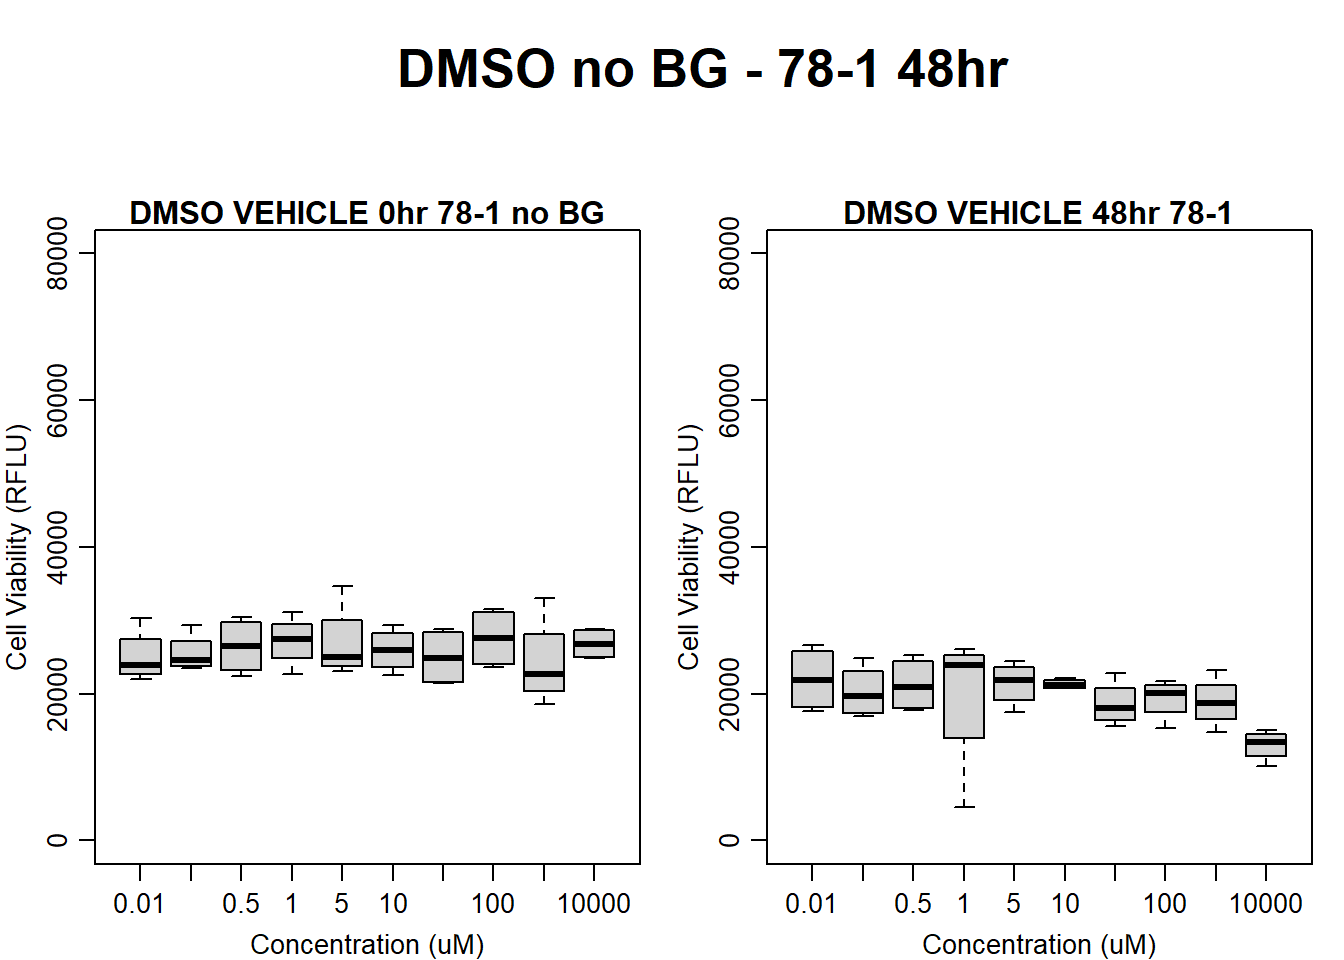
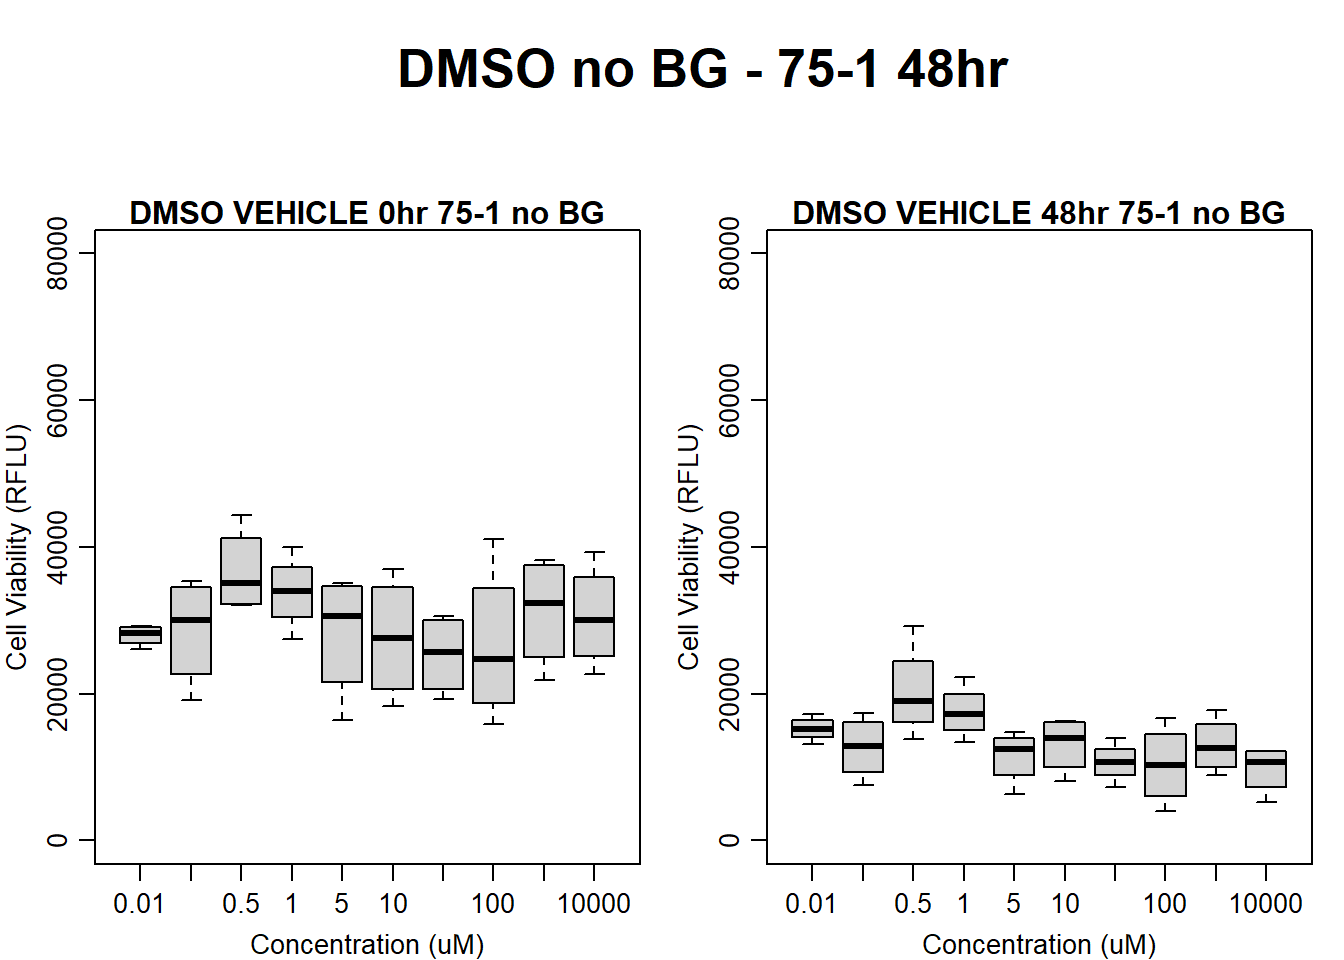
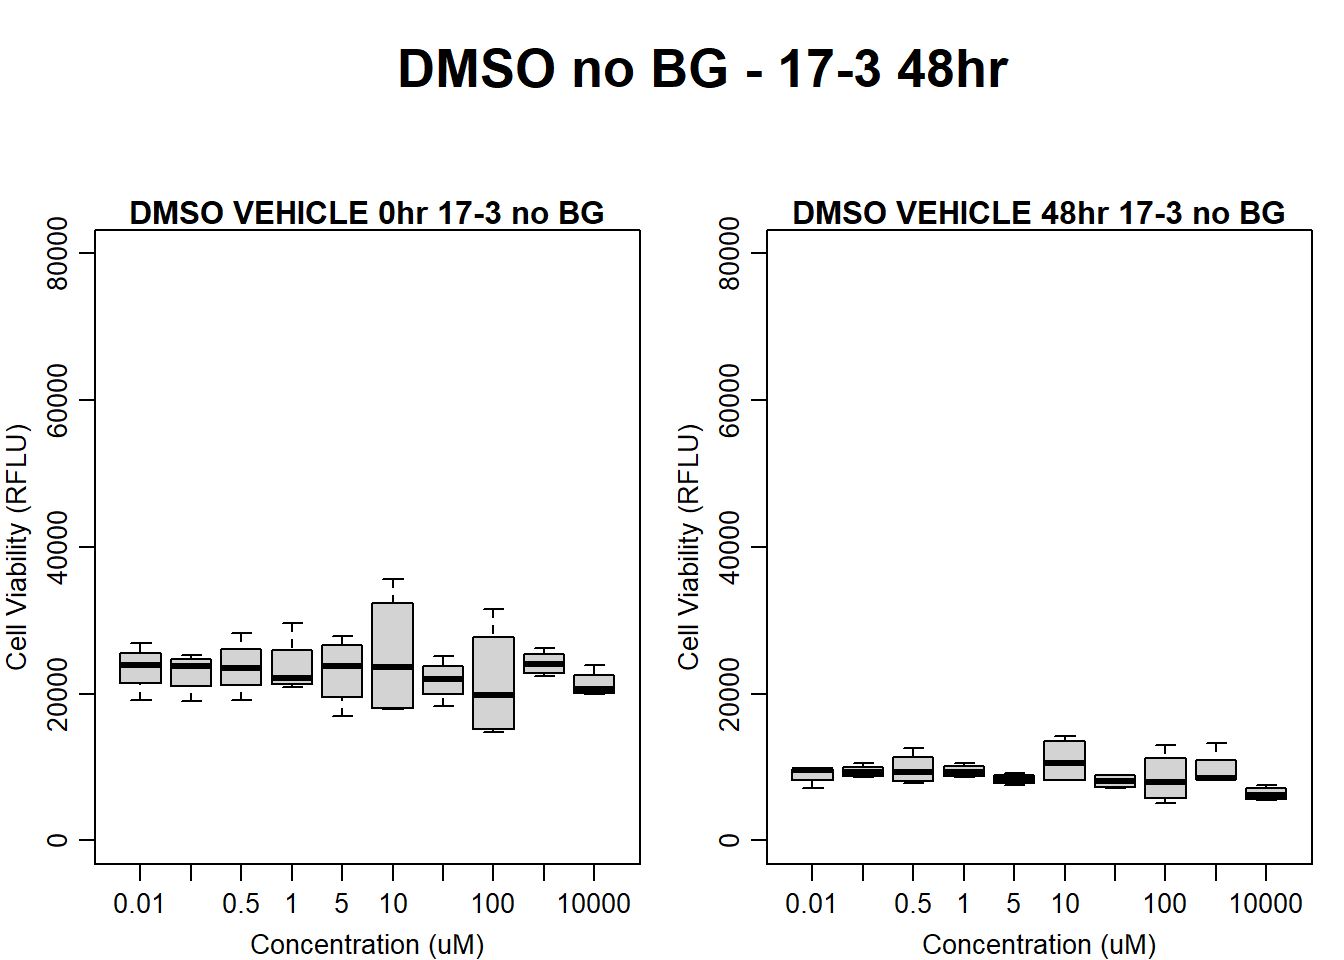
Now that I’ve taken a look at the raw data, let’s look at the analyzed data step by step The following steps were taken in analysis: 1. Import raw fluorescence values (RFLU) from platereader, baseline 0hr and final timepoints 2. Subtract background wells (prestoblue only wells) by plate 3. Subtract average of empty wells (galactose only, with 50k cells/well) by plate 4. Divide all values by matched vehicle average (ie DOX 0.01 / DMSO 0.01) 5. Divide initial 0hr value from final timepoint (24, 48, 72) value
#####DOX Samples#####
#dox 78-1 no BG 24HR
par(mar = c(3.0, 3.0, 1.2, 1), mgp = c(2, .7, 0))
layout(matrix(c(1, 2, 1, 3), nrow = 2, ncol = 2), heights = c(0.5, 2, 2, 2))
#layout.show(3)
plot.new()
text(0.5,0.5,"DOX no BG - 78-1 24hr",cex = 2,font = 2)

boxplot(dox24hr78$Ind2_78_In_noBG ~ dox24hr78$Conc,
        ylim = c(0, 80000),
        ylab = "Cell Viability (RFLU)",
        xlab = "Concentration (uM)",
        main = "DOXORUBICIN 0hr 78-1 no BG"
)

boxplot(dox24hr78$Ind2_78_Fin_noBG ~ dox24hr78$Conc,
        ylim = c(0,80000),
        ylab = "Cell Viability (RFLU)",
        xlab = "Concentration (uM)",
        main = "DOXORUBICIN 24hr 78-1 no BG"
)
| Version | Author | Date |
|---|---|---|
| 109e14b | emmapfort | 2025-03-03 |
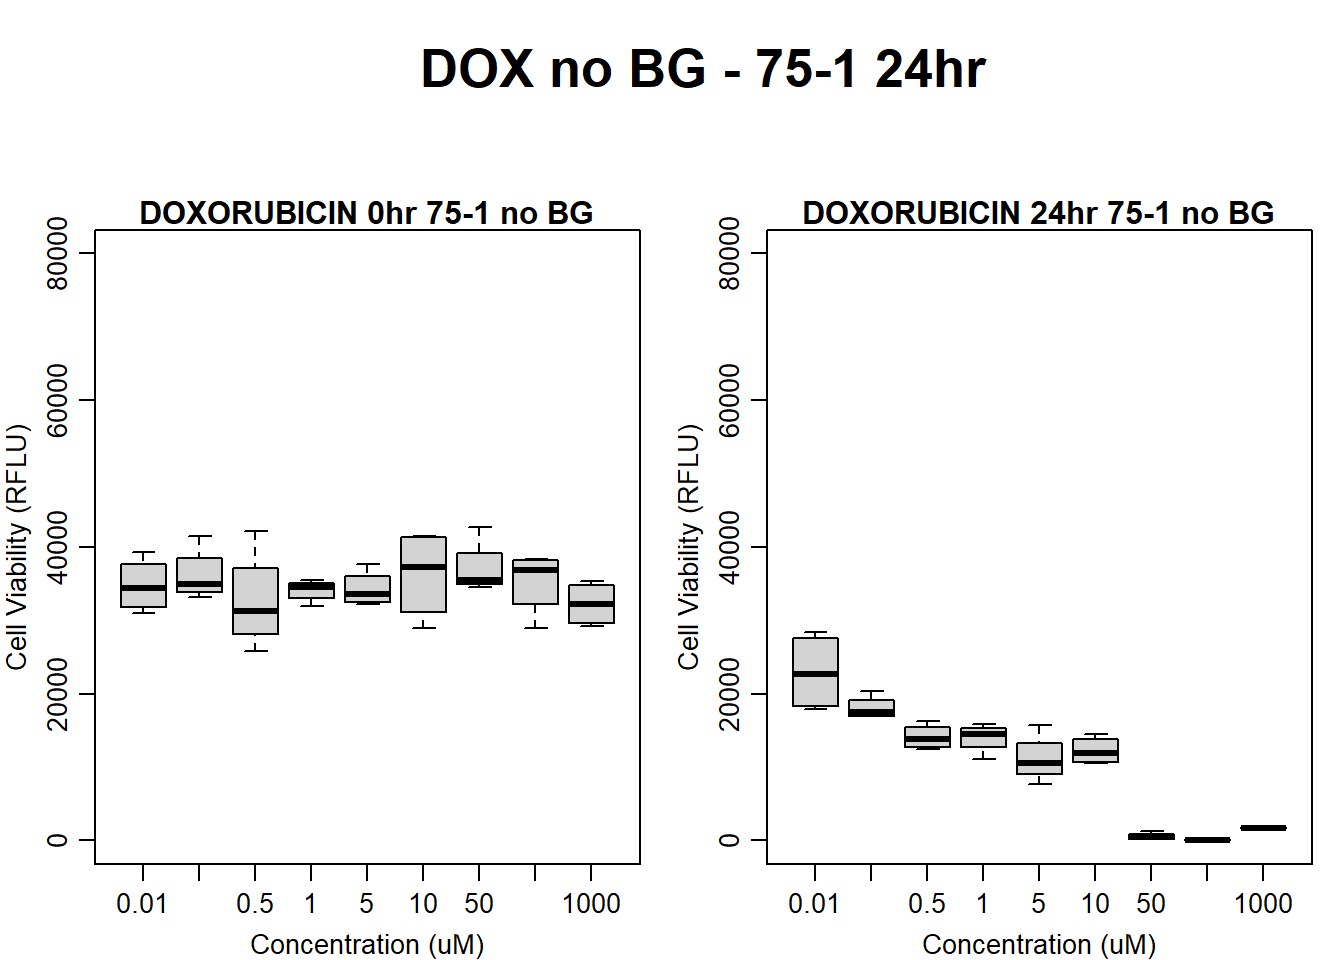
#dox 75-1 24HR
par(mar = c(3.0, 3.0, 1.2, 1), mgp = c(2, .7, 0))
layout(matrix(c(1, 2, 1, 3), nrow = 2, ncol = 2), heights = c(0.5, 2, 2, 2))
#layout.show(3)
plot.new()
text(0.5,0.5,"DOX no BG - 75-1 24hr",cex = 2,font = 2)

boxplot(dox24hr75$Ind1_75_In_noBG ~ dox24hr75$Conc,
        ylim = c(0, 80000),
        ylab = "Cell Viability (RFLU)",
        xlab = "Concentration (uM)",
        main = "DOXORUBICIN 0hr 75-1 no BG"
)

boxplot(dox24hr75$Ind1_75_Fin_noBG ~ dox24hr75$Conc,
        ylim = c(0,80000),
        ylab = "Cell Viability (RFLU)",
        xlab = "Concentration (uM)",
        main = "DOXORUBICIN 24hr 75-1 no BG"
)
| Version | Author | Date |
|---|---|---|
| 109e14b | emmapfort | 2025-03-03 |
#dox 17-3 24HR
par(mar = c(3.0, 3.0, 1.2, 1), mgp = c(2, .7, 0))
layout(matrix(c(1, 2, 1, 3), nrow = 2, ncol = 2), heights = c(0.5, 2, 2, 2))
#layout.show(3)
plot.new()
text(0.5,0.5,"DOX no BG - 17-3 24hr",cex = 2,font = 2)

boxplot(dox24hr17$Ind3_17_In_noBG ~ dox24hr17$Conc,
        ylim = c(0, 80000),
        ylab = "Cell Viability (RFLU)",
        xlab = "Concentration (uM)",
        main = "DOXORUBICIN 0hr 17-3 no BG"
)

boxplot(dox24hr17$Ind3_17_Fin_noBG ~ dox24hr17$Conc,
        ylim = c(0,80000),
        ylab = "Cell Viability (RFLU)",
        xlab = "Concentration (uM)",
        main = "DOXORUBICIN 24hr 17-3 no BG"
)
| Version | Author | Date |
|---|---|---|
| 109e14b | emmapfort | 2025-03-03 |
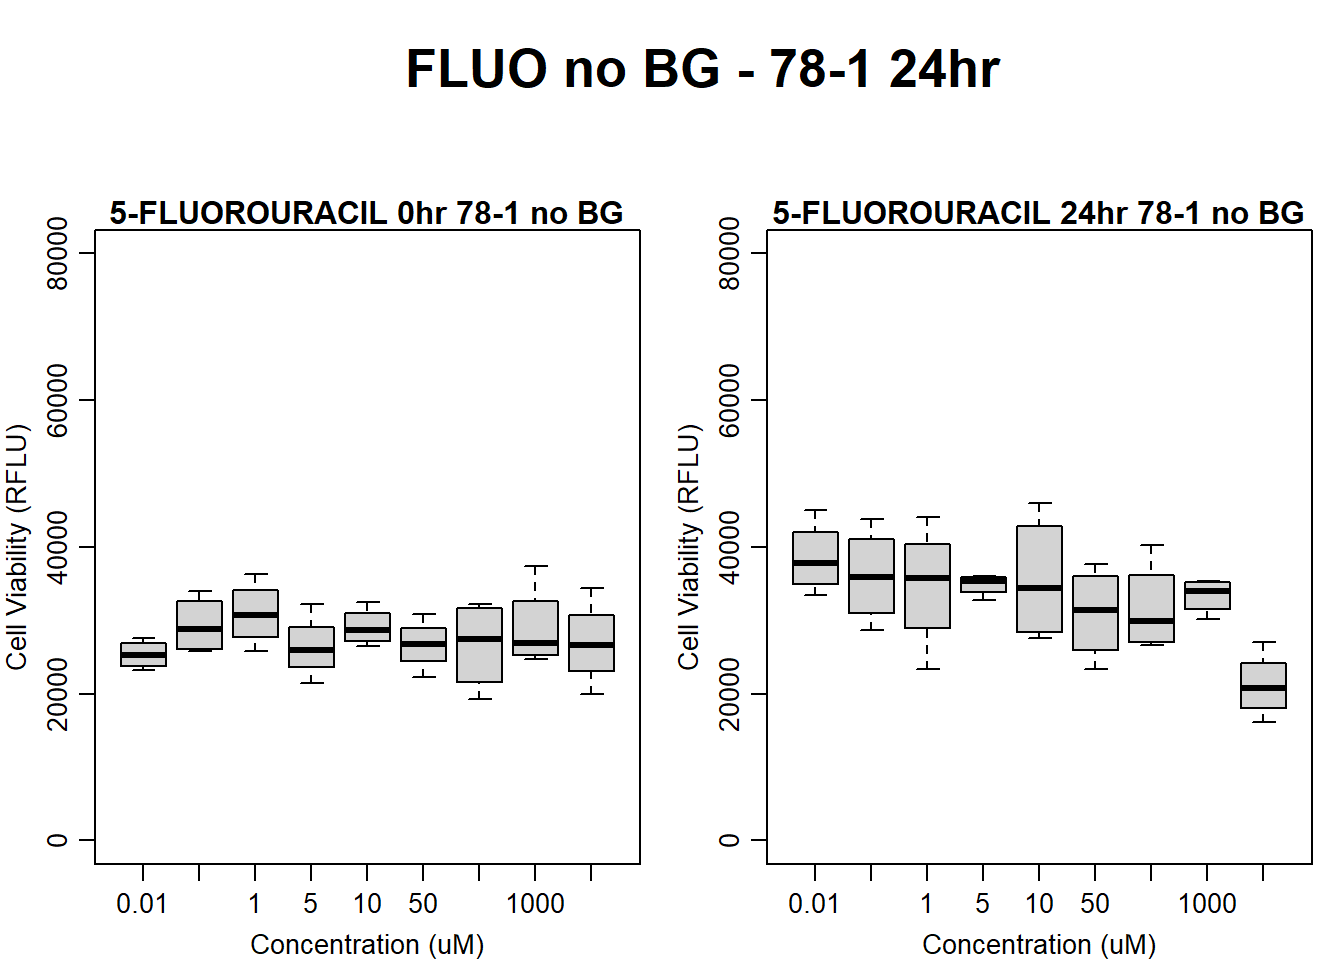
#####FLUO samples#####
#FLUO 78-1 no BG 24HR
par(mar = c(3.0, 3.0, 1.2, 1), mgp = c(2, .7, 0))
layout(matrix(c(1, 2, 1, 3), nrow = 2, ncol = 2), heights = c(0.5, 2, 2, 2))
#layout.show(3)
plot.new()
text(0.5,0.5,"FLUO no BG - 78-1 24hr",cex = 2,font = 2)

boxplot(fluo24hr78$Ind2_78_In_noBG ~ fluo24hr78$Conc,
        ylim = c(0, 80000),
        ylab = "Cell Viability (RFLU)",
        xlab = "Concentration (uM)",
        main = "5-FLUOROURACIL 0hr 78-1 no BG"
)

boxplot(fluo24hr78$Ind2_78_Fin_noBG ~ fluo24hr78$Conc,
        ylim = c(0,80000),
        ylab = "Cell Viability (RFLU)",
        xlab = "Concentration (uM)",
        main = "5-FLUOROURACIL 24hr 78-1 no BG"
)
| Version | Author | Date |
|---|---|---|
| 109e14b | emmapfort | 2025-03-03 |
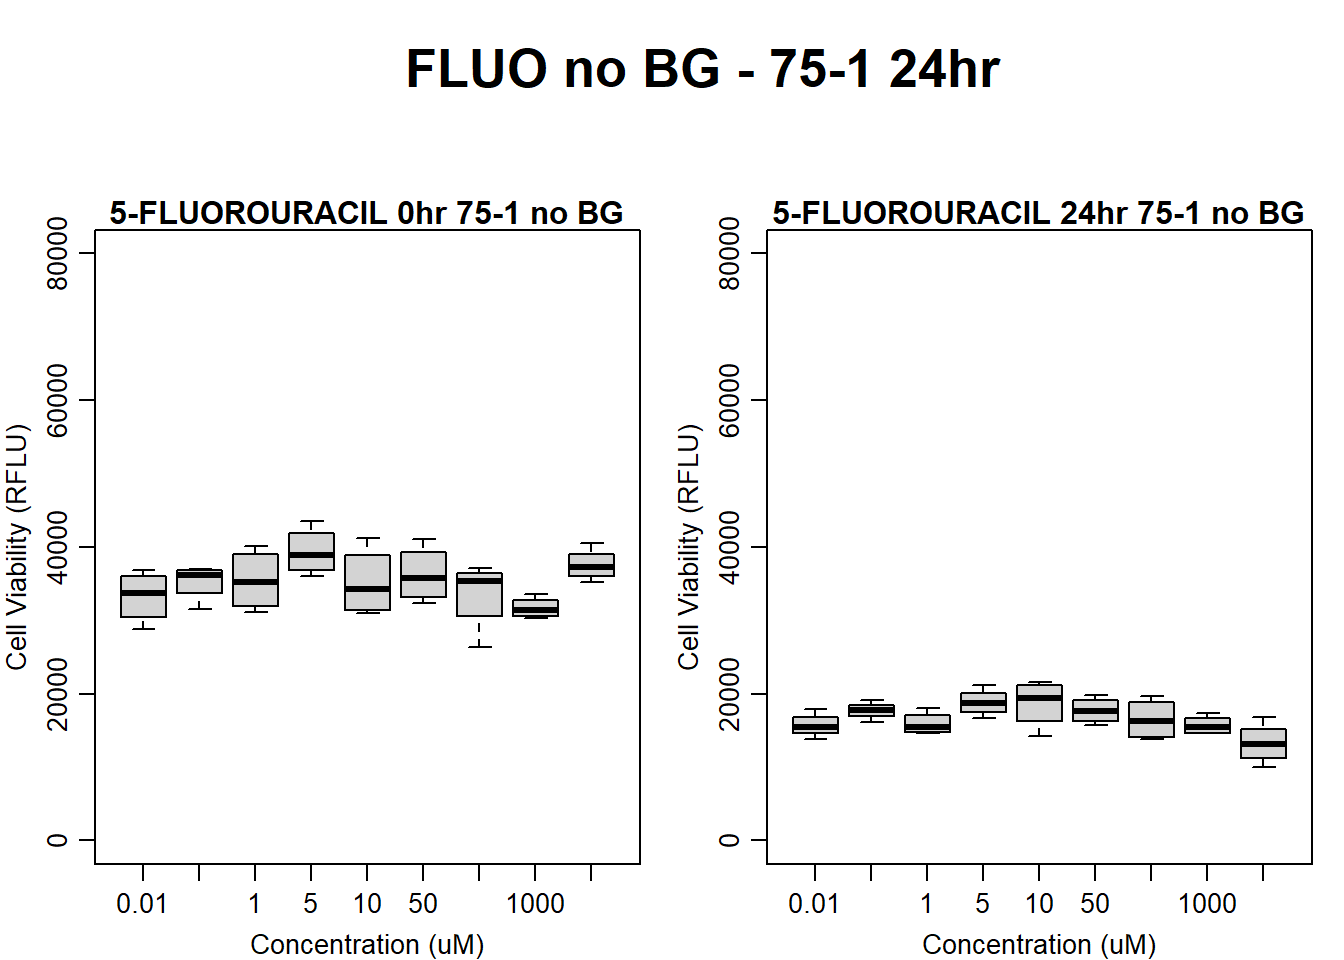
#FLUO 75-1 no BG 24HR
par(mar = c(3.0, 3.0, 1.2, 1), mgp = c(2, .7, 0))
layout(matrix(c(1, 2, 1, 3), nrow = 2, ncol = 2), heights = c(0.5, 2, 2, 2))
#layout.show(3)
plot.new()
text(0.5,0.5,"FLUO no BG - 75-1 24hr",cex = 2,font = 2)

boxplot(fluo24hr75$Ind1_75_In_noBG ~ fluo24hr75$Conc,
        ylim = c(0, 80000),
        ylab = "Cell Viability (RFLU)",
        xlab = "Concentration (uM)",
        main = "5-FLUOROURACIL 0hr 75-1 no BG"
)

boxplot(fluo24hr75$Ind1_75_Fin_noBG ~ fluo24hr75$Conc,
        ylim = c(0,80000),
        ylab = "Cell Viability (RFLU)",
        xlab = "Concentration (uM)",
        main = "5-FLUOROURACIL 24hr 75-1 no BG"
)
| Version | Author | Date |
|---|---|---|
| 109e14b | emmapfort | 2025-03-03 |
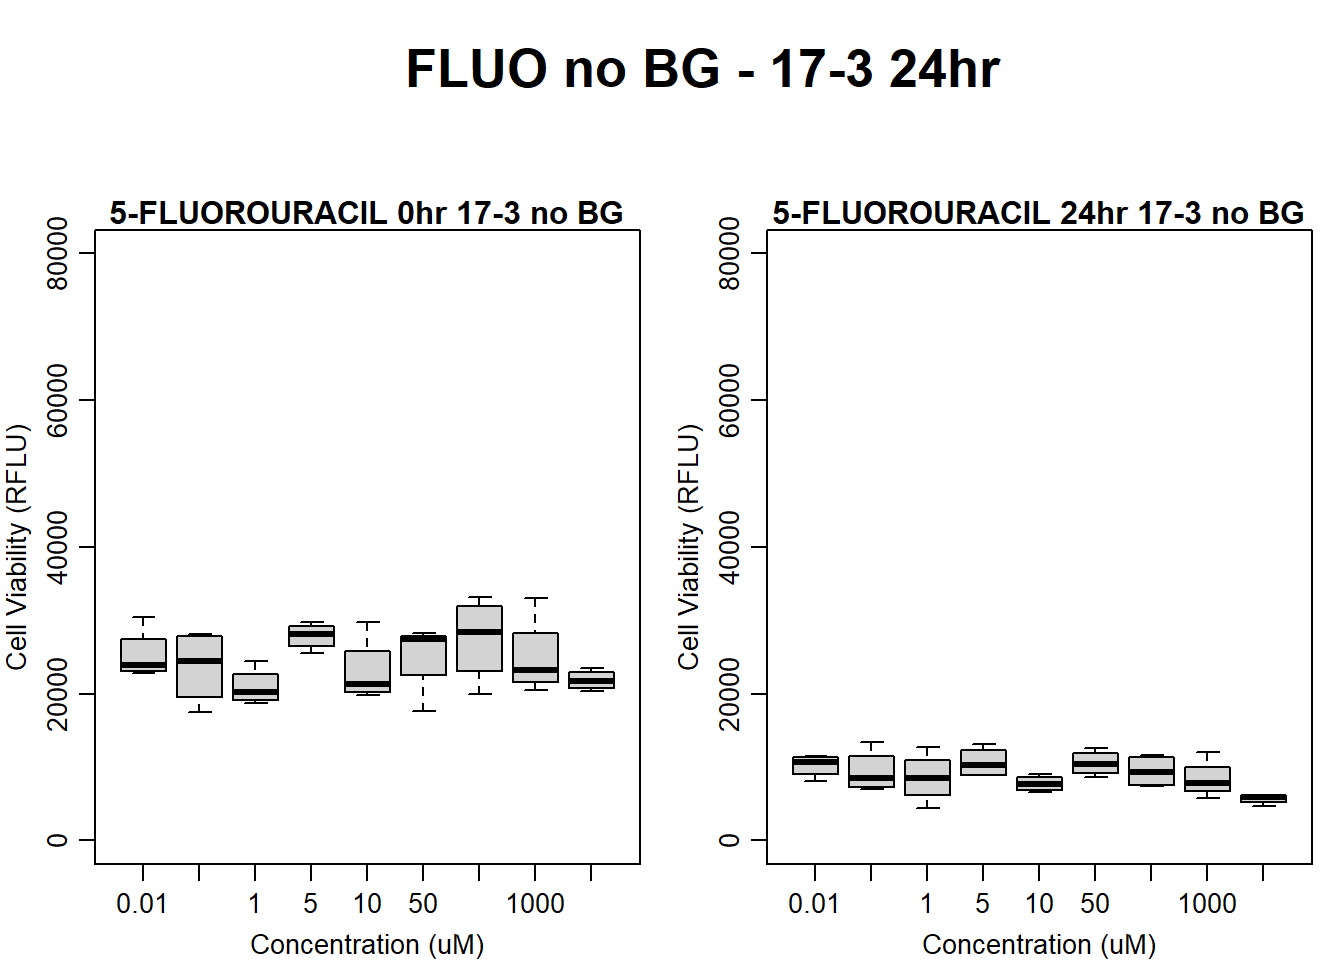
#FLUO 17-3 no BG 24HR
par(mar = c(3.0, 3.0, 1.2, 1), mgp = c(2, .7, 0))
layout(matrix(c(1, 2, 1, 3), nrow = 2, ncol = 2), heights = c(0.5, 2, 2, 2))
#layout.show(3)
plot.new()
text(0.5,0.5,"FLUO no BG - 17-3 24hr",cex = 2,font = 2)

boxplot(fluo24hr17$Ind3_17_In_noBG ~ fluo24hr17$Conc,
        ylim = c(0, 80000),
        ylab = "Cell Viability (RFLU)",
        xlab = "Concentration (uM)",
        main = "5-FLUOROURACIL 0hr 17-3 no BG"
)

boxplot(fluo24hr17$Ind3_17_Fin_noBG ~ fluo24hr17$Conc,
        ylim = c(0, 80000),
        ylab = "Cell Viability (RFLU)",
        xlab = "Concentration (uM)",
        main = "5-FLUOROURACIL 24hr 17-3 no BG"
)
| Version | Author | Date |
|---|---|---|
| 109e14b | emmapfort | 2025-03-03 |
#####DMSO samples#####
#DMSO 78-1 24HR
par(mar = c(3.0, 3.0, 1.2, 1), mgp = c(2, .7, 0))
layout(matrix(c(1, 2, 1, 3), nrow = 2, ncol = 2), heights = c(0.5, 2, 2, 2))
#layout.show(3)
plot.new()
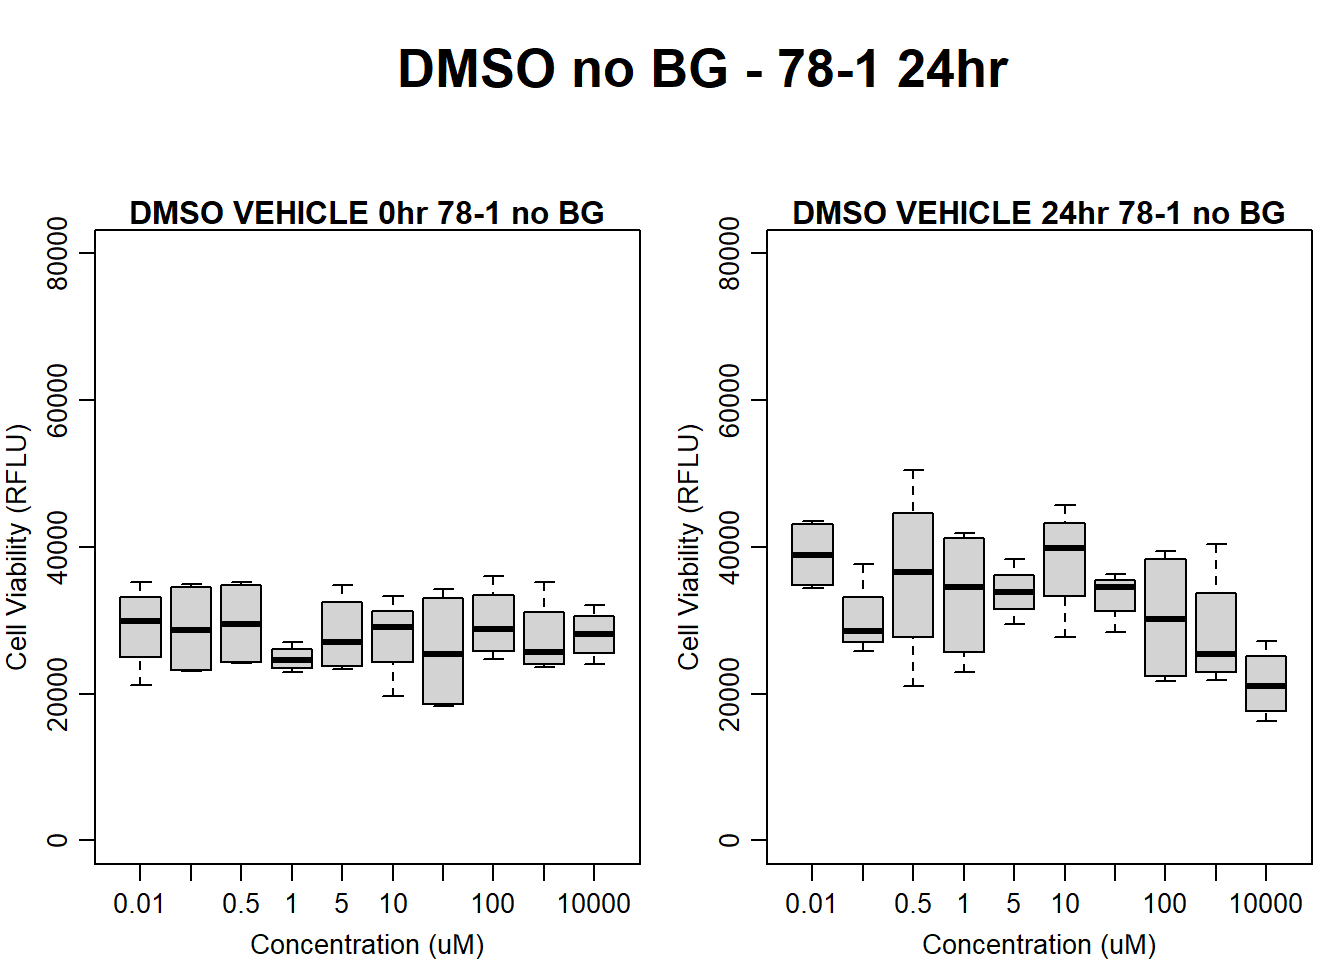
text(0.5,0.5,"DMSO no BG - 78-1 24hr",cex = 2,font = 2)
boxplot(dmso24hr78$Ind2_78_In_noBG ~ dmso24hr78$Conc,
ylim = c(0, 80000),
ylab = "Cell Viability (RFLU)",
xlab = "Concentration (uM)",
main = "DMSO VEHICLE 0hr 78-1 no BG"
)
boxplot(dmso24hr78$Ind2_78_Fin_noBG ~ dmso24hr78$Conc,
ylim = c(0,80000),
ylab = "Cell Viability (RFLU)",
xlab = "Concentration (uM)",
main = "DMSO VEHICLE 24hr 78-1 no BG"
)
| Version | Author | Date |
|---|---|---|
| 109e14b | emmapfort | 2025-03-03 |
#DMSO 75-1 no BG 24HR
par(mar = c(3.0, 3.0, 1.2, 1), mgp = c(2, .7, 0))
layout(matrix(c(1, 2, 1, 3), nrow = 2, ncol = 2), heights = c(0.5, 2, 2, 2))
#layout.show(3)
plot.new()
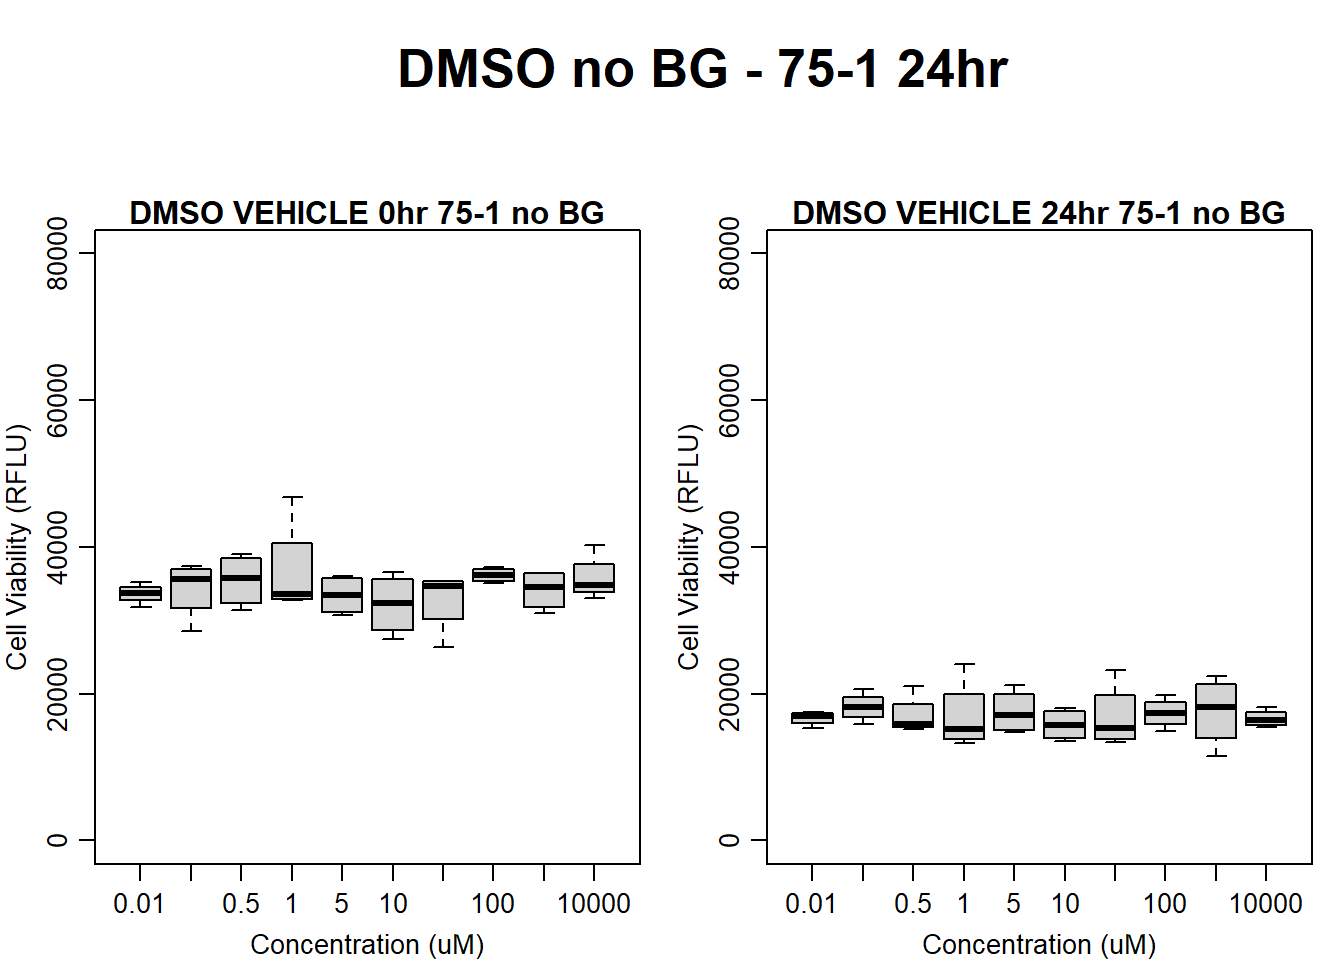
text(0.5,0.5,"DMSO no BG - 75-1 24hr",cex = 2,font = 2)
boxplot(dmso24hr75$Ind1_75_In_noBG ~ dmso24hr75$Conc,
ylim = c(0, 80000),
ylab = "Cell Viability (RFLU)",
xlab = "Concentration (uM)",
main = "DMSO VEHICLE 0hr 75-1 no BG"
)
boxplot(dmso24hr75$Ind1_75_Fin_noBG ~ dmso24hr75$Conc,
ylim = c(0,80000),
ylab = "Cell Viability (RFLU)",
xlab = "Concentration (uM)",
main = "DMSO VEHICLE 24hr 75-1 no BG"
)
| Version | Author | Date |
|---|---|---|
| 109e14b | emmapfort | 2025-03-03 |
#DMSO 17-3 no BG 24HR
par(mar = c(3.0, 3.0, 1.2, 1), mgp = c(2, .7, 0))
layout(matrix(c(1, 2, 1, 3), nrow = 2, ncol = 2), heights = c(0.5, 2, 2, 2))
#layout.show(3)
plot.new()
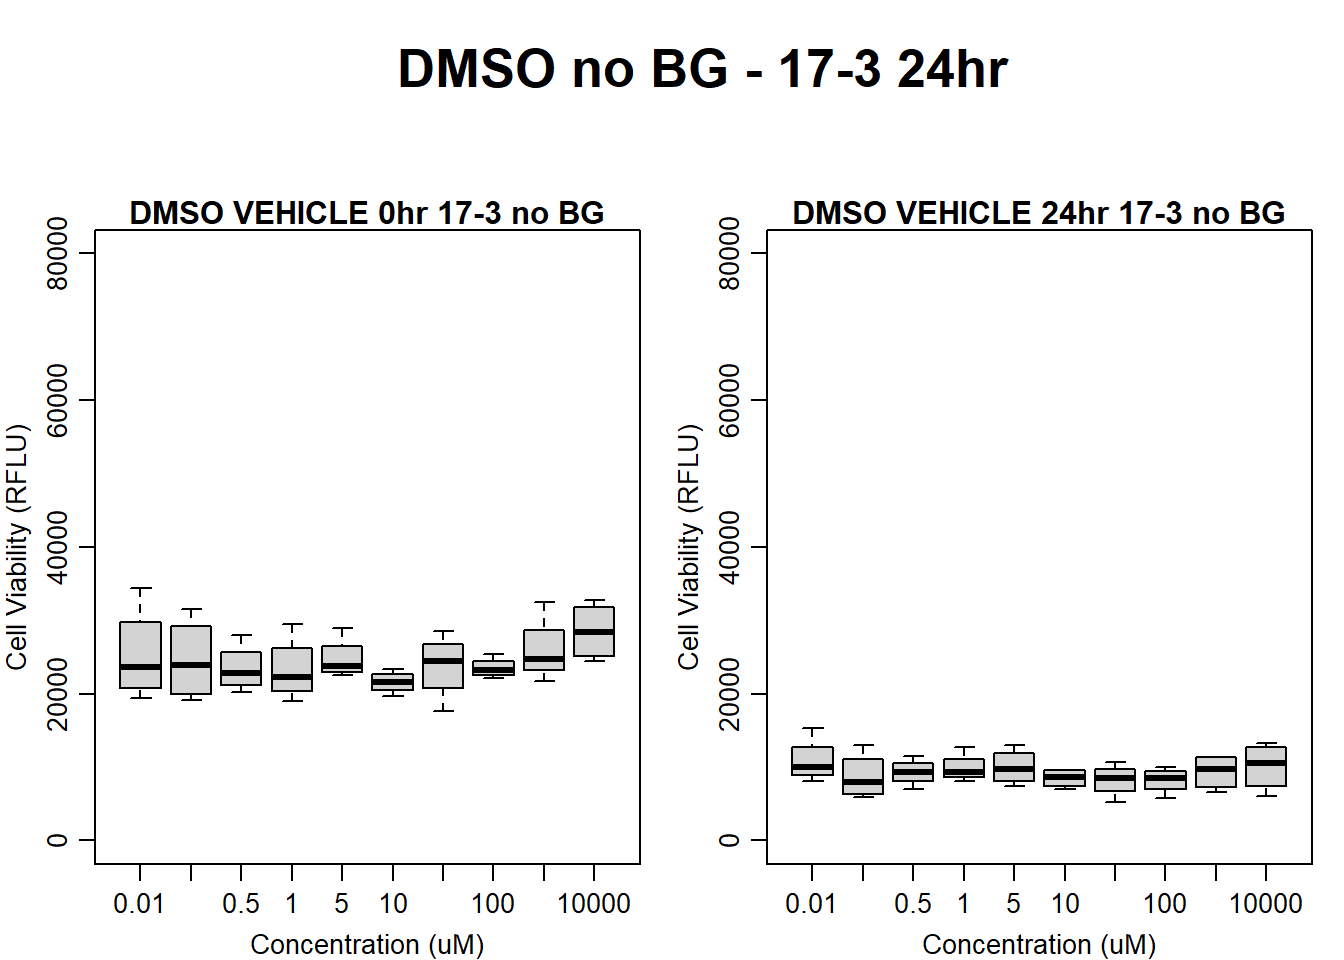
text(0.5,0.5,"DMSO no BG - 17-3 24hr",cex = 2,font = 2)
boxplot(dmso24hr17$Ind3_17_In_noBG ~ dmso24hr17$Conc,
ylim = c(0, 80000),
ylab = "Cell Viability (RFLU)",
xlab = "Concentration (uM)",
main = "DMSO VEHICLE 0hr 17-3 no BG"
)
boxplot(dmso24hr17$Ind3_17_Fin_noBG ~ dmso24hr17$Conc,
ylim = c(0,80000),
ylab = "Cell Viability (RFLU)",
xlab = "Concentration (uM)",
main = "DMSO VEHICLE 24hr 17-3 no BG"
)
| Version | Author | Date |
|---|---|---|
| 109e14b | emmapfort | 2025-03-03 |
#####DOX Samples#####
#dox 78-1 no BG 48HR
par(mar = c(3.0, 3.0, 1.2, 1), mgp = c(2, .7, 0))
layout(matrix(c(1, 2, 1, 3), nrow = 2, ncol = 2), heights = c(0.5, 2, 2, 2))
#layout.show(3)
plot.new()
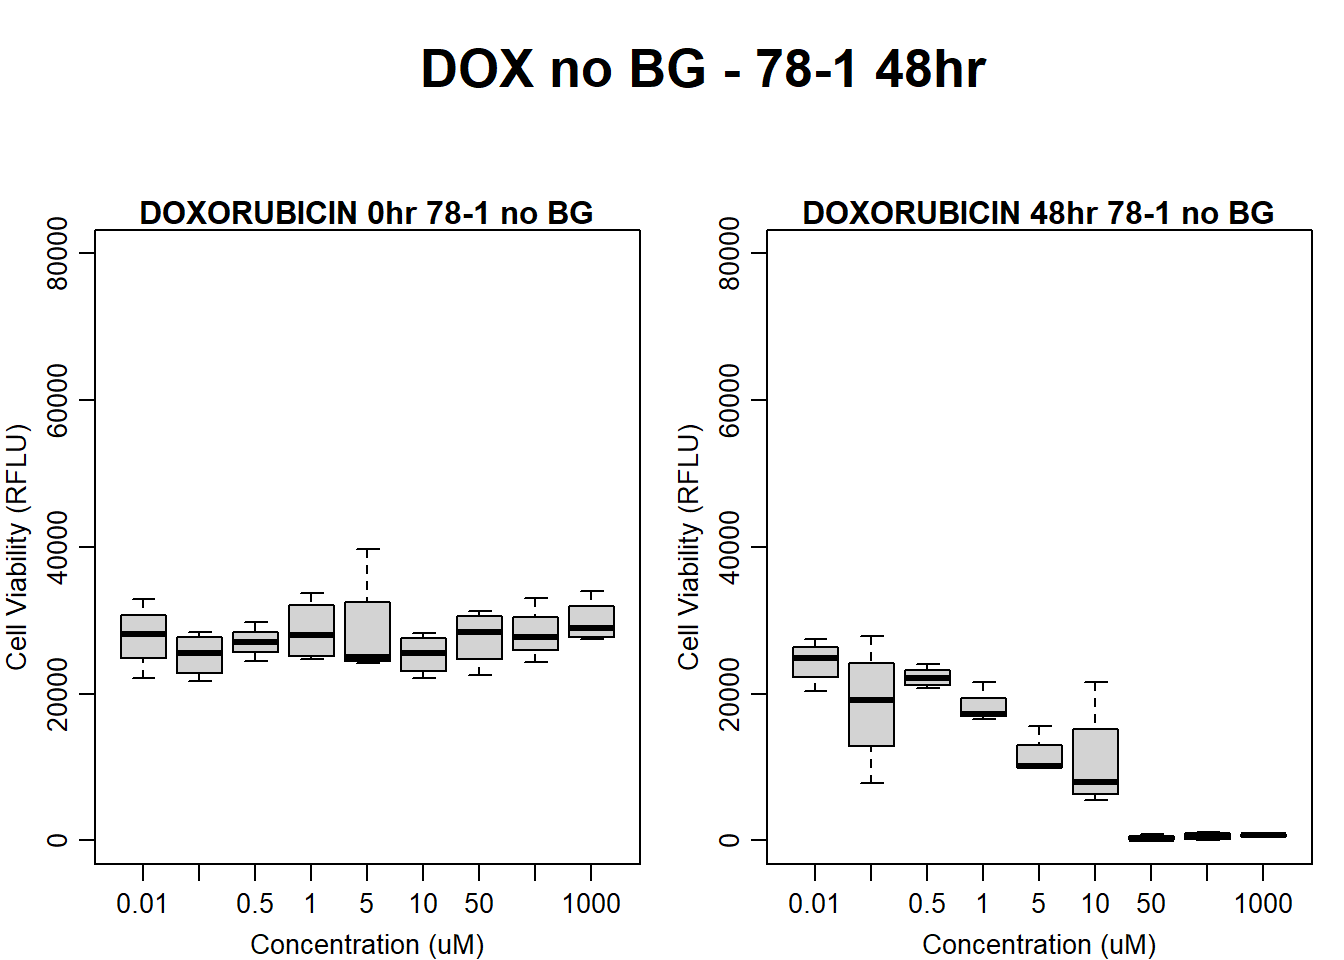
text(0.5,0.5,"DOX no BG - 78-1 48hr",cex = 2,font = 2)
boxplot(dox48hr78$Ind2_78_In_noBG ~ dox48hr78$Conc,
ylim = c(0, 80000),
ylab = "Cell Viability (RFLU)",
xlab = "Concentration (uM)",
main = "DOXORUBICIN 0hr 78-1 no BG"
)
boxplot(dox48hr78$Ind2_78_Fin_noBG ~ dox48hr78$Conc,
ylim = c(0,80000),
ylab = "Cell Viability (RFLU)",
xlab = "Concentration (uM)",
main = "DOXORUBICIN 48hr 78-1 no BG"
)
| Version | Author | Date |
|---|---|---|
| 109e14b | emmapfort | 2025-03-03 |
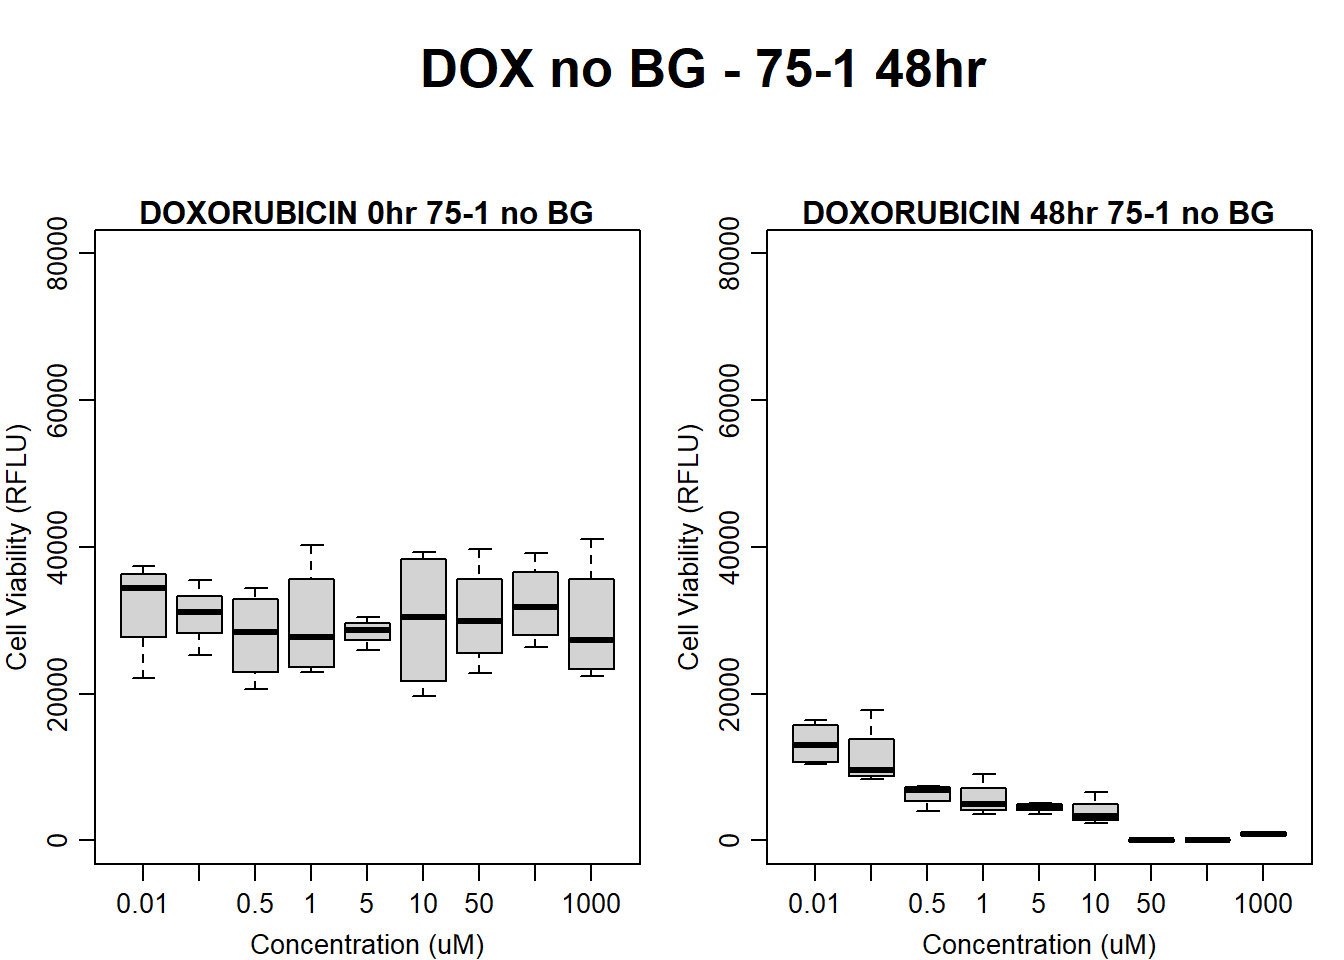
#dox 75-1 48HR
par(mar = c(3.0, 3.0, 1.2, 1), mgp = c(2, .7, 0))
layout(matrix(c(1, 2, 1, 3), nrow = 2, ncol = 2), heights = c(0.5, 2, 2, 2))
#layout.show(3)
plot.new()
text(0.5,0.5,"DOX no BG - 75-1 48hr",cex = 2,font = 2)

boxplot(dox48hr75$Ind1_75_In_noBG ~ dox48hr75$Conc,
        ylim = c(0, 80000),
        ylab = "Cell Viability (RFLU)",
        xlab = "Concentration (uM)",
        main = "DOXORUBICIN 0hr 75-1 no BG"
)

boxplot(dox48hr75$Ind1_75_Fin_noBG ~ dox48hr75$Conc,
        ylim = c(0,80000),
        ylab = "Cell Viability (RFLU)",
        xlab = "Concentration (uM)",
        main = "DOXORUBICIN 48hr 75-1 no BG"
)
| Version | Author | Date |
|---|---|---|
| 109e14b | emmapfort | 2025-03-03 |
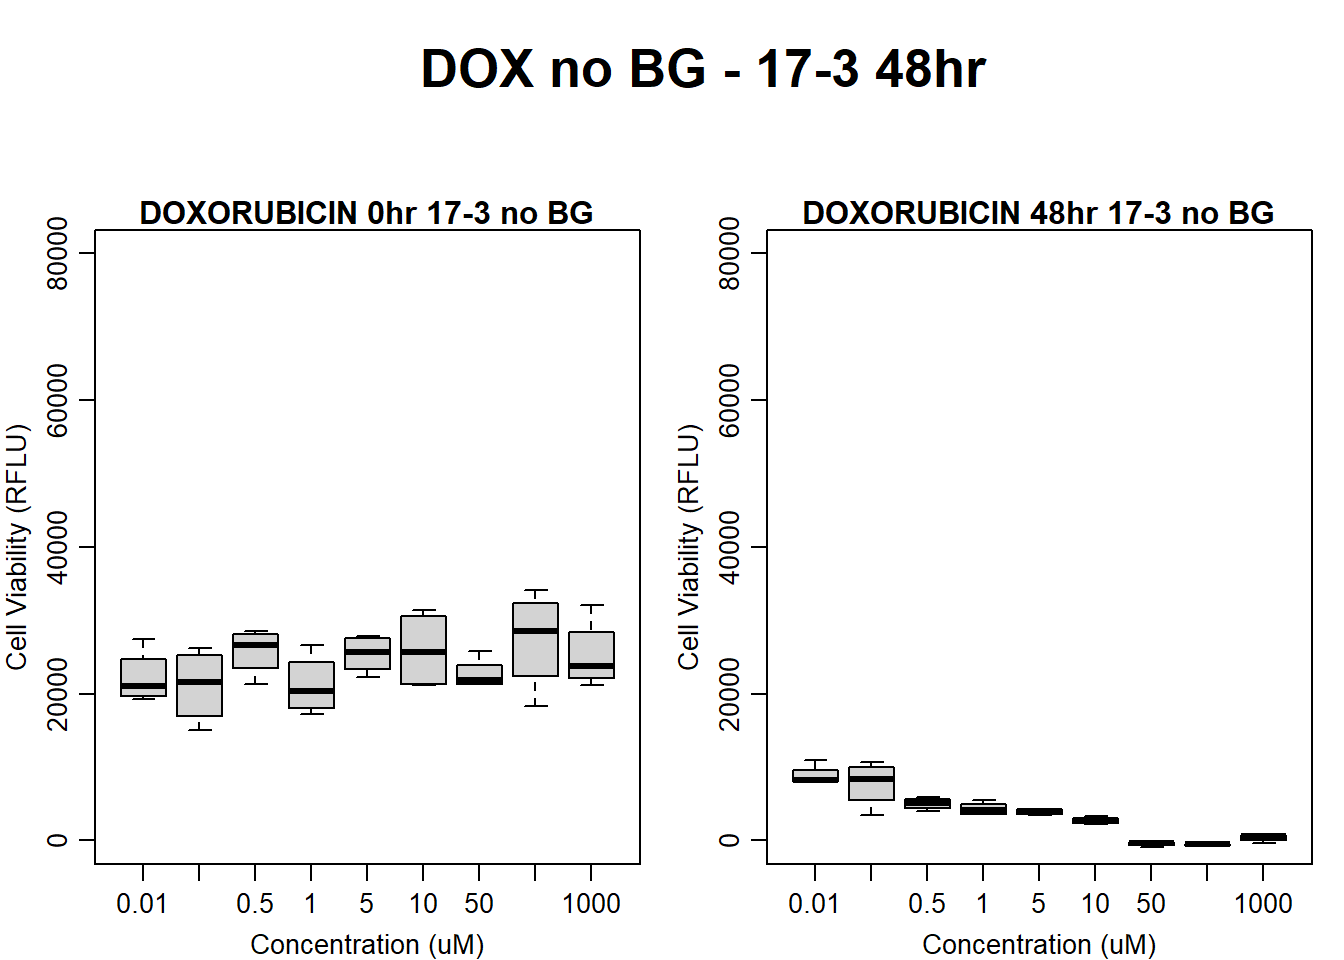
#dox 17-3 48HR
par(mar = c(3.0, 3.0, 1.2, 1), mgp = c(2, .7, 0))
layout(matrix(c(1, 2, 1, 3), nrow = 2, ncol = 2), heights = c(0.5, 2, 2, 2))
#layout.show(3)
plot.new()
text(0.5,0.5,"DOX no BG - 17-3 48hr",cex = 2,font = 2)

boxplot(dox48hr17$Ind3_17_In_noBG ~ dox48hr17$Conc,
        ylim = c(0, 80000),
        ylab = "Cell Viability (RFLU)",
        xlab = "Concentration (uM)",
        main = "DOXORUBICIN 0hr 17-3 no BG"
)

boxplot(dox48hr17$Ind3_17_Fin_noBG ~ dox48hr17$Conc,
        ylim = c(0,80000),
        ylab = "Cell Viability (RFLU)",
        xlab = "Concentration (uM)",
        main = "DOXORUBICIN 48hr 17-3 no BG"
)
| Version | Author | Date |
|---|---|---|
| 109e14b | emmapfort | 2025-03-03 |
#####FLUO samples#####
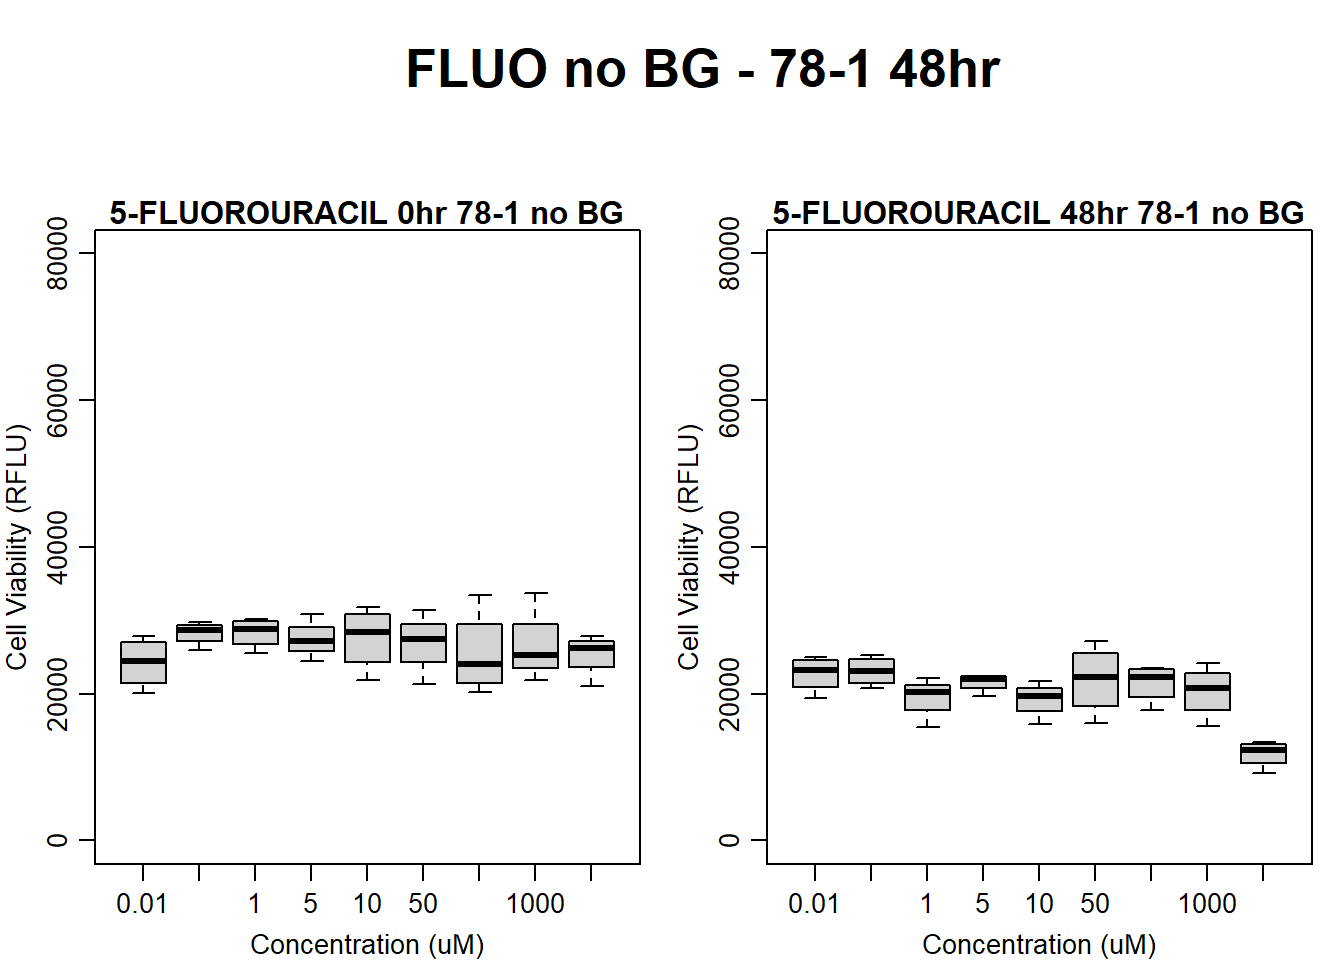
#FLUO 78-1 no BG 48HR
par(mar = c(3.0, 3.0, 1.2, 1), mgp = c(2, .7, 0))
layout(matrix(c(1, 2, 1, 3), nrow = 2, ncol = 2), heights = c(0.5, 2, 2, 2))
#layout.show(3)
plot.new()
text(0.5,0.5,"FLUO no BG - 78-1 48hr",cex = 2,font = 2)
boxplot(fluo48hr78$Ind2_78_In_noBG ~ fluo48hr78$Conc,
ylim = c(0, 80000),
ylab = "Cell Viability (RFLU)",
xlab = "Concentration (uM)",
main = "5-FLUOROURACIL 0hr 78-1 no BG"
)
boxplot(fluo48hr78$Ind2_78_Fin_noBG ~ fluo48hr78$Conc,
ylim = c(0,80000),
ylab = "Cell Viability (RFLU)",
xlab = "Concentration (uM)",
main = "5-FLUOROURACIL 48hr 78-1 no BG"
)
| Version | Author | Date |
|---|---|---|
| 109e14b | emmapfort | 2025-03-03 |
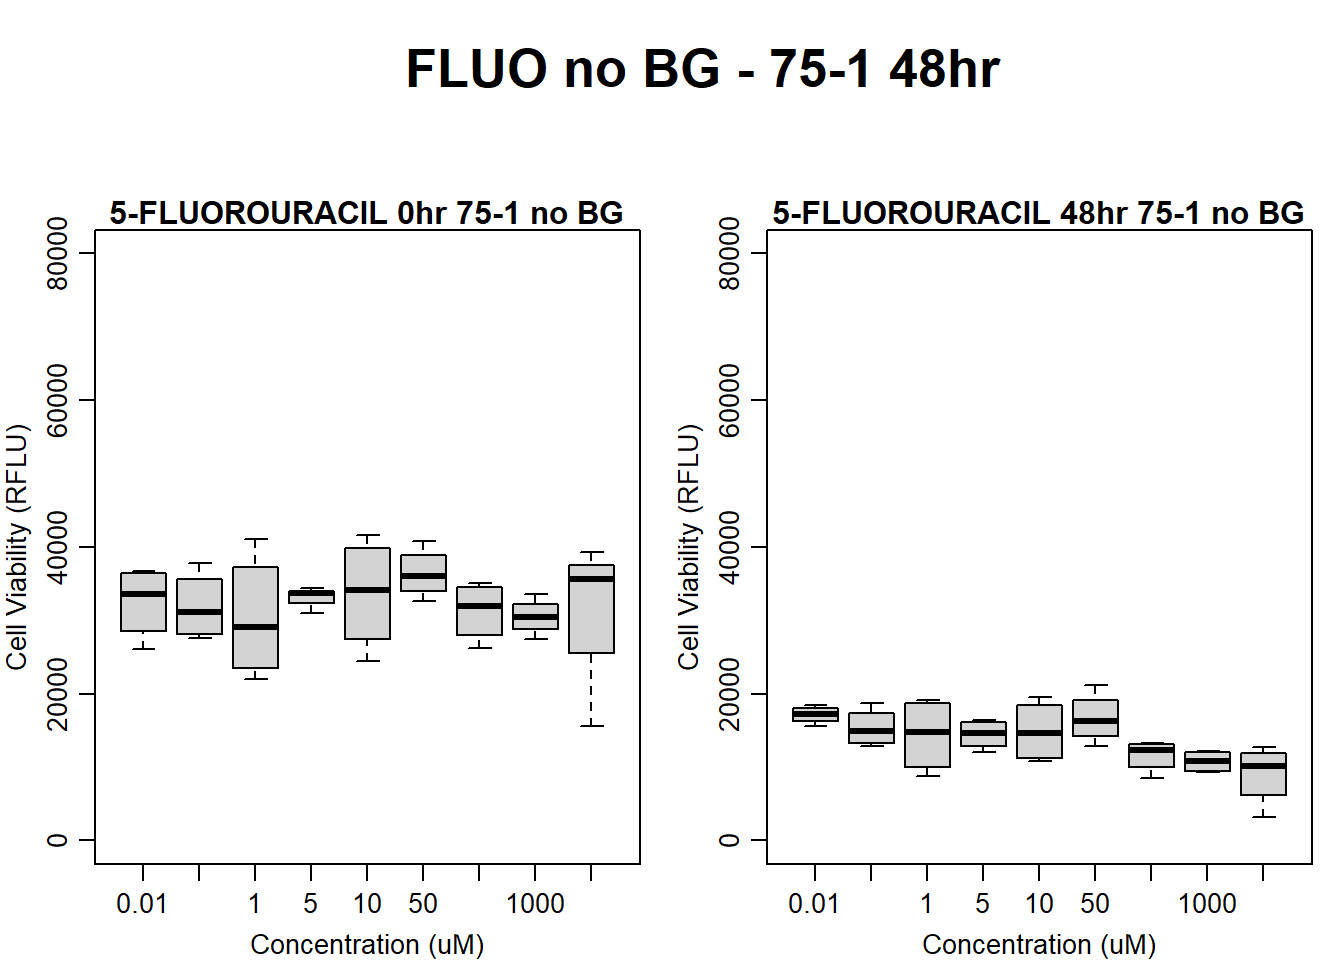
#FLUO 75-1 no BG 48HR
par(mar = c(3.0, 3.0, 1.2, 1), mgp = c(2, .7, 0))
layout(matrix(c(1, 2, 1, 3), nrow = 2, ncol = 2), heights = c(0.5, 2, 2, 2))
#layout.show(3)
plot.new()
text(0.5,0.5,"FLUO no BG - 75-1 48hr",cex = 2,font = 2)

boxplot(fluo48hr75$Ind1_75_In_noBG ~ fluo48hr75$Conc,
        ylim = c(0, 80000),
        ylab = "Cell Viability (RFLU)",
        xlab = "Concentration (uM)",
        main = "5-FLUOROURACIL 0hr 75-1 no BG"
)

boxplot(fluo48hr75$Ind1_75_Fin_noBG ~ fluo48hr75$Conc,
        ylim = c(0,80000),
        ylab = "Cell Viability (RFLU)",
        xlab = "Concentration (uM)",
        main = "5-FLUOROURACIL 48hr 75-1 no BG"
)
| Version | Author | Date |
|---|---|---|
| 109e14b | emmapfort | 2025-03-03 |
#FLUO 17-3 no BG 48HR
par(mar = c(3.0, 3.0, 1.2, 1), mgp = c(2, .7, 0))
layout(matrix(c(1, 2, 1, 3), nrow = 2, ncol = 2), heights = c(0.5, 2, 2, 2))
#layout.show(3)
plot.new()
text(0.5,0.5,"FLUO no BG - 17-3 48hr",cex = 2,font = 2)

boxplot(fluo48hr17$Ind3_17_In_noBG ~ fluo48hr17$Conc,
        ylim = c(0, 80000),
        ylab = "Cell Viability (RFLU)",
        xlab = "Concentration (uM)",
        main = "5-FLUOROURACIL 0hr 17-3 no BG"
)

boxplot(fluo48hr17$Ind3_17_Fin_noBG ~ fluo48hr17$Conc,
        ylim = c(0, 80000),
        ylab = "Cell Viability (RFLU)",
        xlab = "Concentration (uM)",
        main = "5-FLUOROURACIL 48hr 17-3 no BG"
)
| Version | Author | Date |
|---|---|---|
| 109e14b | emmapfort | 2025-03-03 |
#####DMSO samples#####
#DMSO 78-1 48HR
par(mar = c(3.0, 3.0, 1.2, 1), mgp = c(2, .7, 0))
layout(matrix(c(1, 2, 1, 3), nrow = 2, ncol = 2), heights = c(0.5, 2, 2, 2))
#layout.show(3)
plot.new()
text(0.5,0.5,"DMSO no BG - 78-1 48hr",cex = 2,font = 2)

boxplot(dmso48hr78$Ind2_78_In_noBG ~ dmso48hr78$Conc,
        ylim = c(0, 80000),
        ylab = "Cell Viability (RFLU)",
        xlab = "Concentration (uM)",
        main = "DMSO VEHICLE 0hr 78-1 no BG"
)

boxplot(dmso48hr78$Ind2_78_Fin_noBG ~ dmso48hr78$Conc,
        ylim = c(0,80000),
        ylab = "Cell Viability (RFLU)",
        xlab = "Concentration (uM)",
        main = "DMSO VEHICLE 48hr 78-1"
)
| Version | Author | Date |
|---|---|---|
| 109e14b | emmapfort | 2025-03-03 |
#DMSO 75-1 no BG 48HR
par(mar = c(3.0, 3.0, 1.2, 1), mgp = c(2, .7, 0))
layout(matrix(c(1, 2, 1, 3), nrow = 2, ncol = 2), heights = c(0.5, 2, 2, 2))
#layout.show(3)
plot.new()
text(0.5,0.5,"DMSO no BG - 75-1 48hr",cex = 2,font = 2)

boxplot(dmso48hr75$Ind1_75_In_noBG ~ dmso48hr75$Conc,
        ylim = c(0, 80000),
        ylab = "Cell Viability (RFLU)",
        xlab = "Concentration (uM)",
        main = "DMSO VEHICLE 0hr 75-1 no BG"
)

boxplot(dmso48hr75$Ind1_75_Fin_noBG ~ dmso48hr75$Conc,
        ylim = c(0,80000),
        ylab = "Cell Viability (RFLU)",
        xlab = "Concentration (uM)",
        main = "DMSO VEHICLE 48hr 75-1 no BG"
)
| Version | Author | Date |
|---|---|---|
| 109e14b | emmapfort | 2025-03-03 |
#DMSO 17-3 no BG 48HR
par(mar = c(3.0, 3.0, 1.2, 1), mgp = c(2, .7, 0))
layout(matrix(c(1, 2, 1, 3), nrow = 2, ncol = 2), heights = c(0.5, 2, 2, 2))
#layout.show(3)
plot.new()
text(0.5,0.5,"DMSO no BG - 17-3 48hr",cex = 2,font = 2)

boxplot(dmso48hr17$Ind3_17_In_noBG ~ dmso48hr17$Conc,
        ylim = c(0, 80000),
        ylab = "Cell Viability (RFLU)",
        xlab = "Concentration (uM)",
        main = "DMSO VEHICLE 0hr 17-3 no BG"
)

boxplot(dmso48hr17$Ind3_17_Fin_noBG ~ dmso48hr17$Conc,
        ylim = c(0,80000),
        ylab = "Cell Viability (RFLU)",
        xlab = "Concentration (uM)",
        main = "DMSO VEHICLE 48hr 17-3 no BG"
)
| Version | Author | Date |
|---|---|---|
| 109e14b | emmapfort | 2025-03-03 |
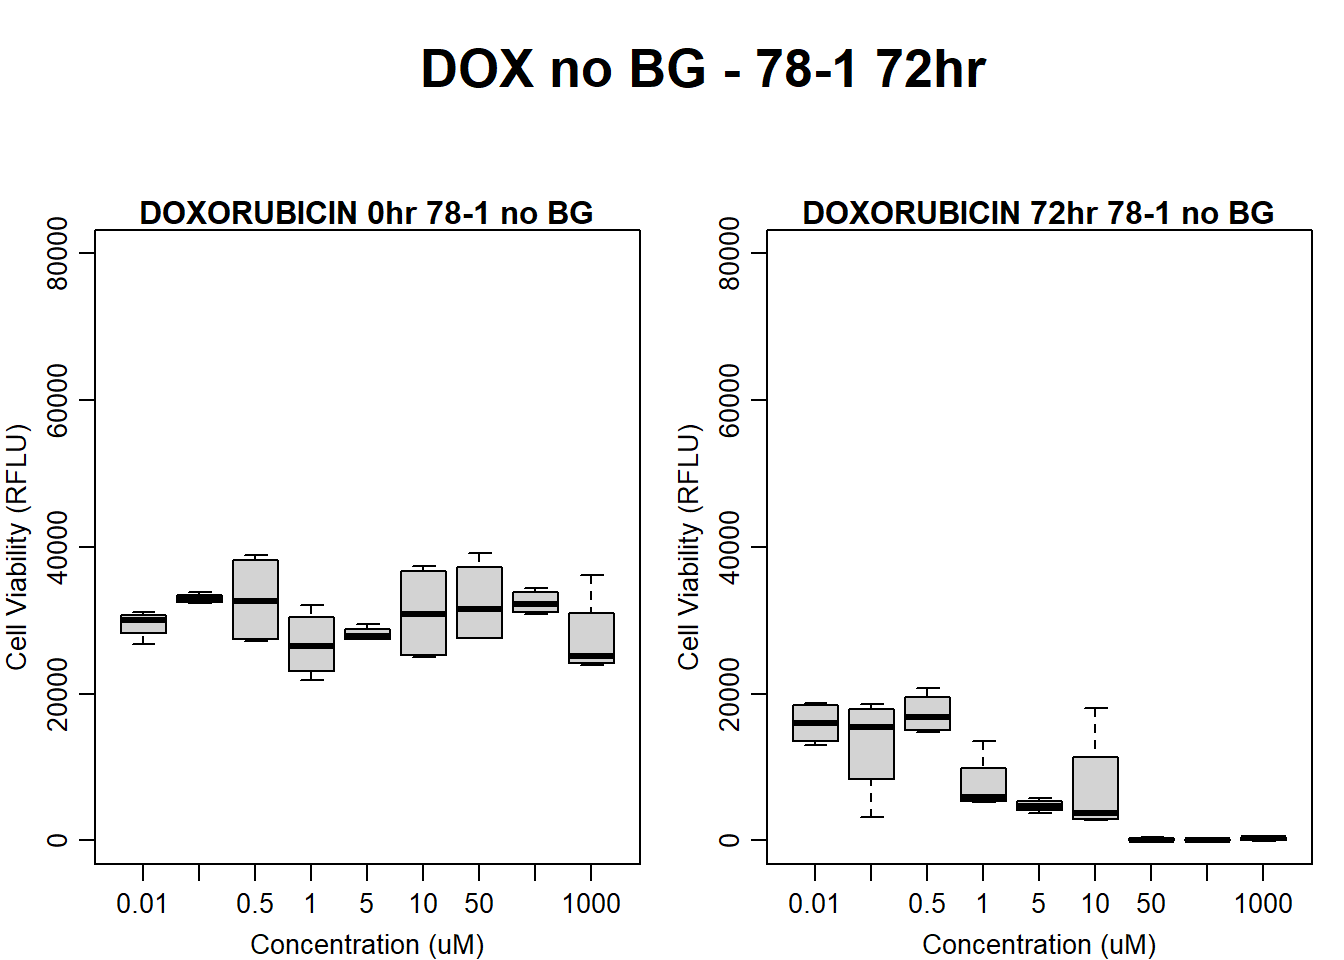
#####DOX Samples#####
#dox 78-1 no BG 72HR
par(mar = c(3.0, 3.0, 1.2, 1), mgp = c(2, .7, 0))
layout(matrix(c(1, 2, 1, 3), nrow = 2, ncol = 2), heights = c(0.5, 2, 2, 2))
#layout.show(3)
plot.new()
text(0.5,0.5,"DOX no BG - 78-1 72hr",cex = 2,font = 2)

boxplot(dox72hr78$Ind2_78_In_noBG ~ dox72hr78$Conc,
        ylim = c(0, 80000),
        ylab = "Cell Viability (RFLU)",
        xlab = "Concentration (uM)",
        main = "DOXORUBICIN 0hr 78-1 no BG"
)

boxplot(dox72hr78$Ind2_78_Fin_noBG ~ dox72hr78$Conc,
        ylim = c(0,80000),
        ylab = "Cell Viability (RFLU)",
        xlab = "Concentration (uM)",
        main = "DOXORUBICIN 72hr 78-1 no BG"
)
| Version | Author | Date |
|---|---|---|
| 109e14b | emmapfort | 2025-03-03 |
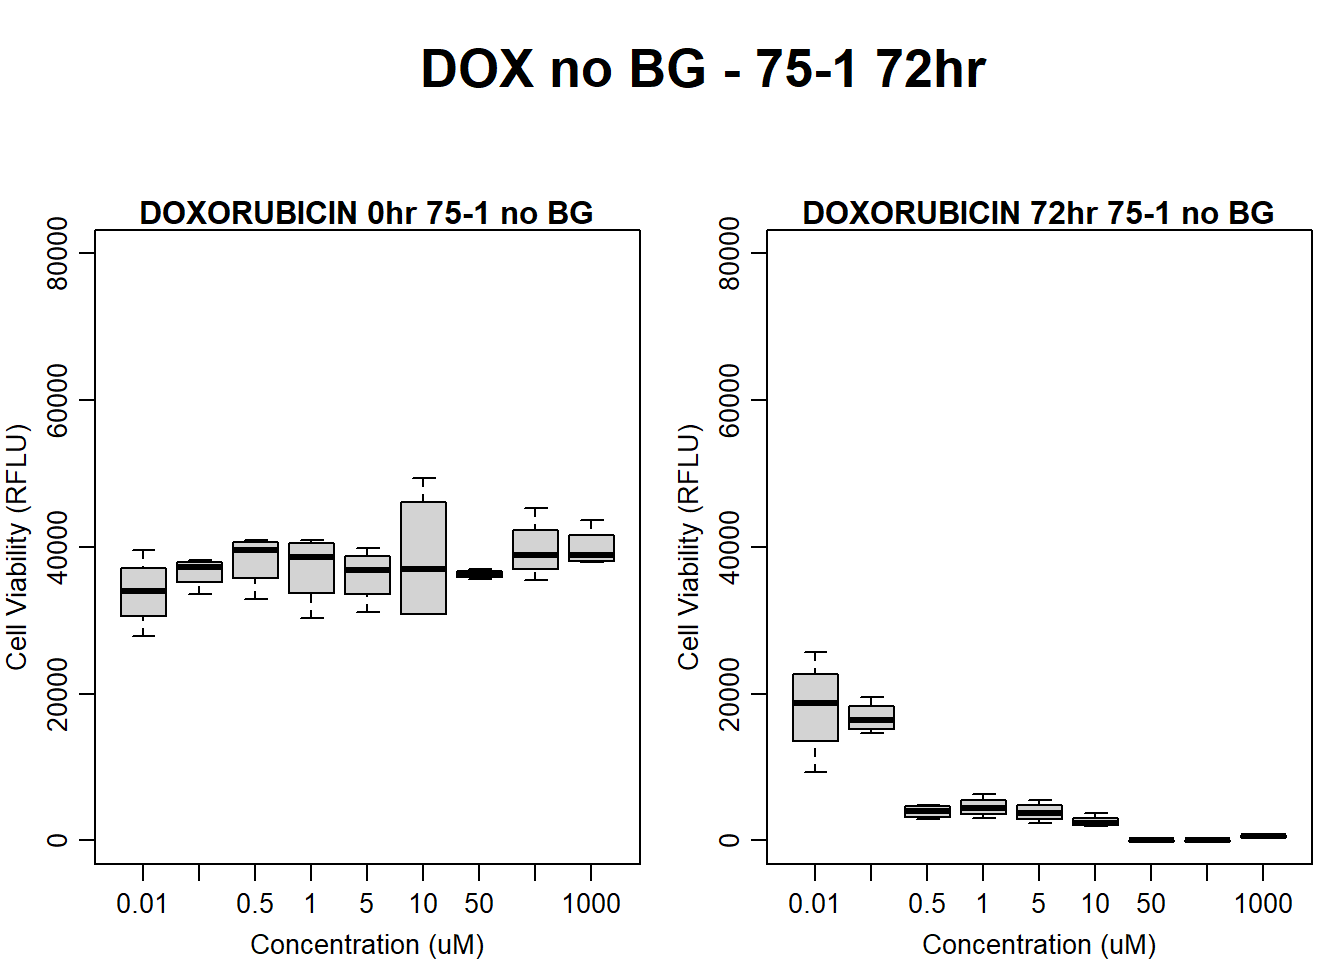
#dox 75-1 72HR
par(mar = c(3.0, 3.0, 1.2, 1), mgp = c(2, .7, 0))
layout(matrix(c(1, 2, 1, 3), nrow = 2, ncol = 2), heights = c(0.5, 2, 2, 2))
#layout.show(3)
plot.new()
text(0.5,0.5,"DOX no BG - 75-1 72hr",cex = 2,font = 2)

boxplot(dox72hr75$Ind1_75_In_noBG ~ dox72hr75$Conc,
        ylim = c(0, 80000),
        ylab = "Cell Viability (RFLU)",
        xlab = "Concentration (uM)",
        main = "DOXORUBICIN 0hr 75-1 no BG"
)

boxplot(dox72hr75$Ind1_75_Fin_noBG ~ dox72hr75$Conc,
        ylim = c(0,80000),
        ylab = "Cell Viability (RFLU)",
        xlab = "Concentration (uM)",
        main = "DOXORUBICIN 72hr 75-1 no BG"
)
| Version | Author | Date |
|---|---|---|
| 109e14b | emmapfort | 2025-03-03 |
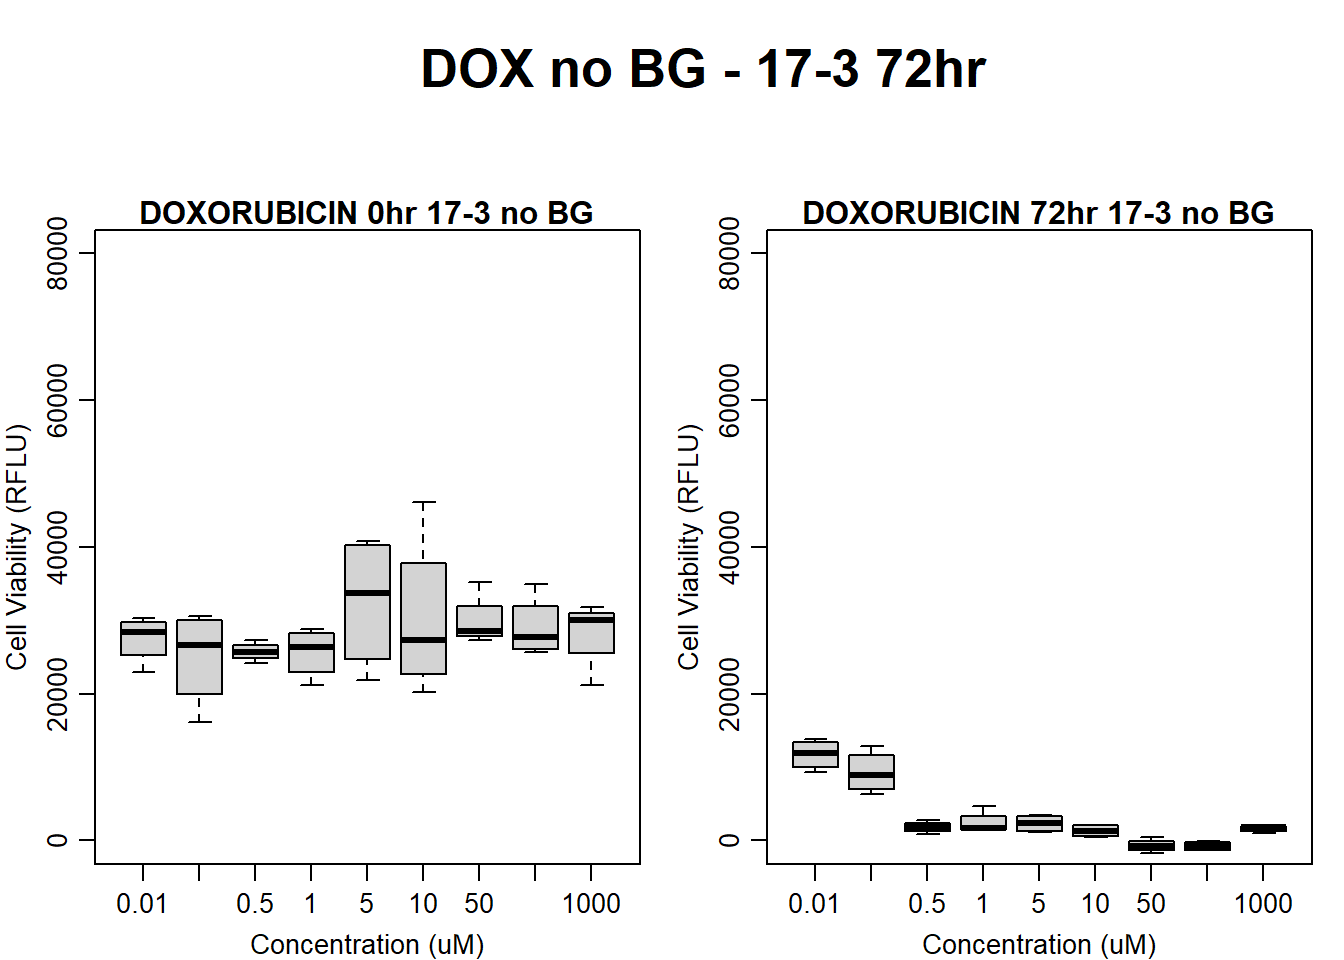
#dox 17-3 72HR
par(mar = c(3.0, 3.0, 1.2, 1), mgp = c(2, .7, 0))
layout(matrix(c(1, 2, 1, 3), nrow = 2, ncol = 2), heights = c(0.5, 2, 2, 2))
#layout.show(3)
plot.new()
text(0.5,0.5,"DOX no BG - 17-3 72hr",cex = 2,font = 2)

boxplot(dox72hr17$Ind3_17_In_noBG ~ dox72hr17$Conc,
        ylim = c(0, 80000),
        ylab = "Cell Viability (RFLU)",
        xlab = "Concentration (uM)",
        main = "DOXORUBICIN 0hr 17-3 no BG"
)

boxplot(dox72hr17$Ind3_17_Fin_noBG ~ dox72hr17$Conc,
        ylim = c(0,80000),
        ylab = "Cell Viability (RFLU)",
        xlab = "Concentration (uM)",
        main = "DOXORUBICIN 72hr 17-3 no BG"
)
| Version | Author | Date |
|---|---|---|
| 109e14b | emmapfort | 2025-03-03 |
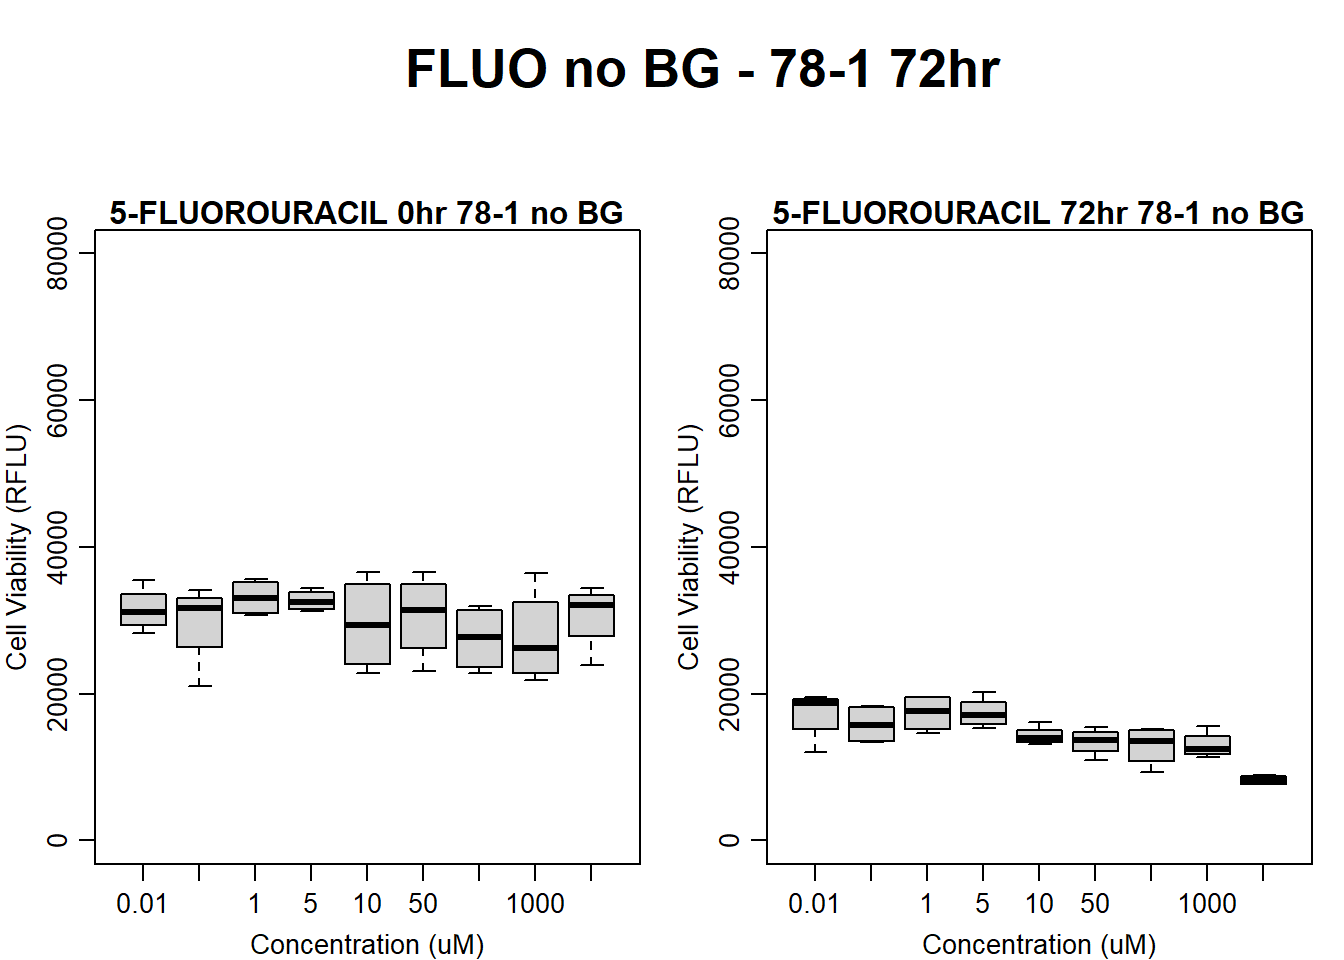
#####FLUO samples#####
#FLUO 78-1 no BG 72HR
par(mar = c(3.0, 3.0, 1.2, 1), mgp = c(2, .7, 0))
layout(matrix(c(1, 2, 1, 3), nrow = 2, ncol = 2), heights = c(0.5, 2, 2, 2))
#layout.show(3)
plot.new()
text(0.5,0.5,"FLUO no BG - 78-1 72hr",cex = 2,font = 2)

boxplot(fluo72hr78$Ind2_78_In_noBG ~ fluo72hr78$Conc,
        ylim = c(0, 80000),
        ylab = "Cell Viability (RFLU)",
        xlab = "Concentration (uM)",
        main = "5-FLUOROURACIL 0hr 78-1 no BG"
)

boxplot(fluo72hr78$Ind2_78_Fin_noBG ~ fluo72hr78$Conc,
        ylim = c(0,80000),
        ylab = "Cell Viability (RFLU)",
        xlab = "Concentration (uM)",
        main = "5-FLUOROURACIL 72hr 78-1 no BG"
)
| Version | Author | Date |
|---|---|---|
| 109e14b | emmapfort | 2025-03-03 |
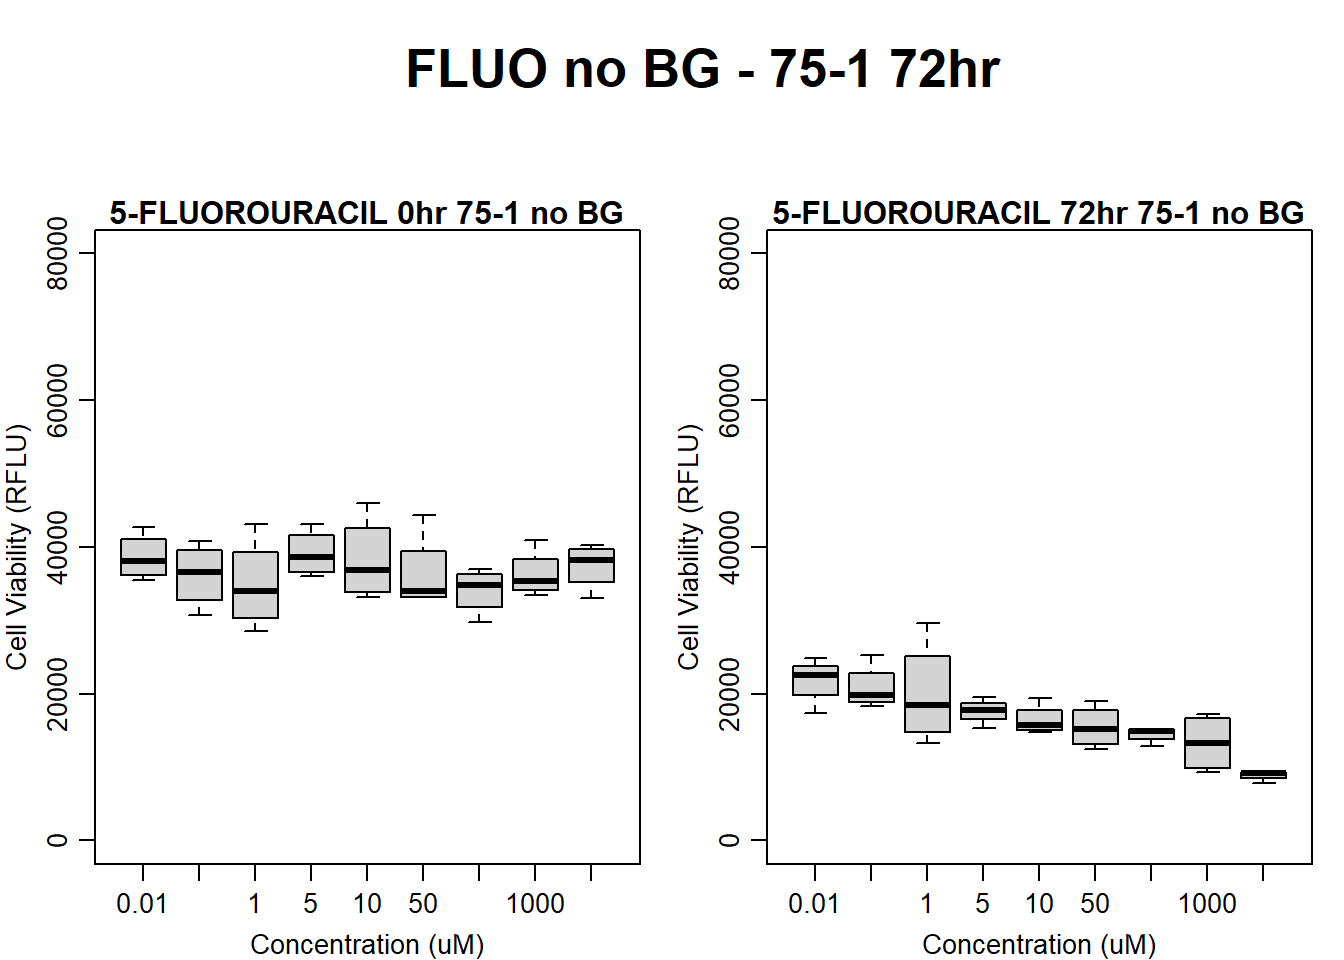
#FLUO 75-1 no BG 72HR
par(mar = c(3.0, 3.0, 1.2, 1), mgp = c(2, .7, 0))
layout(matrix(c(1, 2, 1, 3), nrow = 2, ncol = 2), heights = c(0.5, 2, 2, 2))
#layout.show(3)
plot.new()
text(0.5,0.5,"FLUO no BG - 75-1 72hr",cex = 2,font = 2)

boxplot(fluo72hr75$Ind1_75_In_noBG ~ fluo72hr75$Conc,
        ylim = c(0, 80000),
        ylab = "Cell Viability (RFLU)",
        xlab = "Concentration (uM)",
        main = "5-FLUOROURACIL 0hr 75-1 no BG"
)

boxplot(fluo72hr75$Ind1_75_Fin_noBG ~ fluo72hr75$Conc,
        ylim = c(0,80000),
        ylab = "Cell Viability (RFLU)",
        xlab = "Concentration (uM)",
        main = "5-FLUOROURACIL 72hr 75-1 no BG"
)
| Version | Author | Date |
|---|---|---|
| 109e14b | emmapfort | 2025-03-03 |
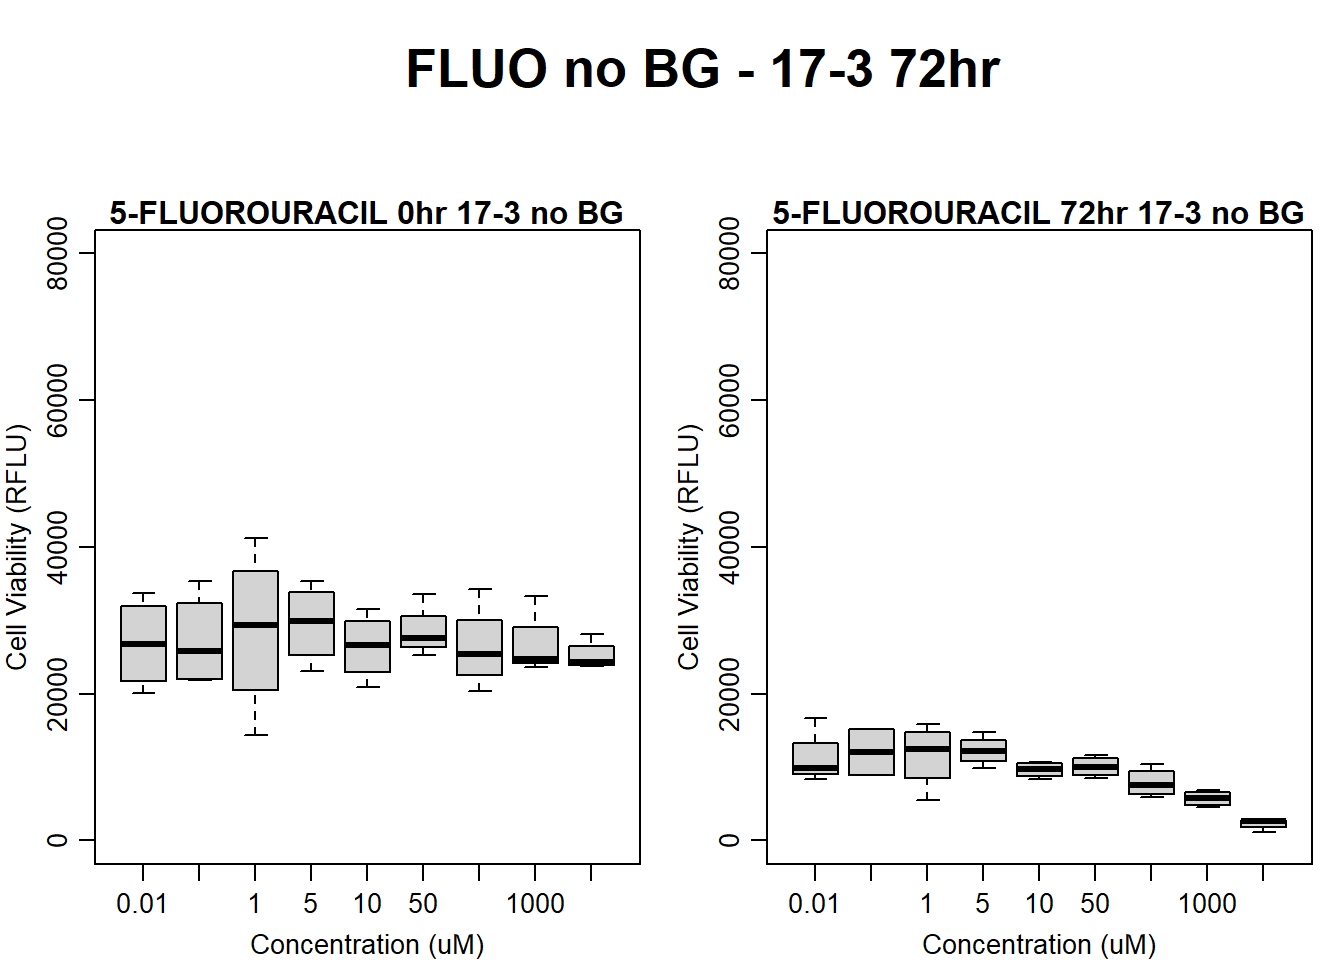
#FLUO 17-3 no BG 72HR
par(mar = c(3.0, 3.0, 1.2, 1), mgp = c(2, .7, 0))
layout(matrix(c(1, 2, 1, 3), nrow = 2, ncol = 2), heights = c(0.5, 2, 2, 2))
#layout.show(3)
plot.new()
text(0.5,0.5,"FLUO no BG - 17-3 72hr",cex = 2,font = 2)

boxplot(fluo72hr17$Ind3_17_In_noBG ~ fluo72hr17$Conc,
        ylim = c(0, 80000),
        ylab = "Cell Viability (RFLU)",
        xlab = "Concentration (uM)",
        main = "5-FLUOROURACIL 0hr 17-3 no BG"
)

boxplot(fluo72hr17$Ind3_17_Fin_noBG ~ fluo72hr17$Conc,
        ylim = c(0, 80000),
        ylab = "Cell Viability (RFLU)",
        xlab = "Concentration (uM)",
        main = "5-FLUOROURACIL 72hr 17-3 no BG"
)
| Version | Author | Date |
|---|---|---|
| 109e14b | emmapfort | 2025-03-03 |
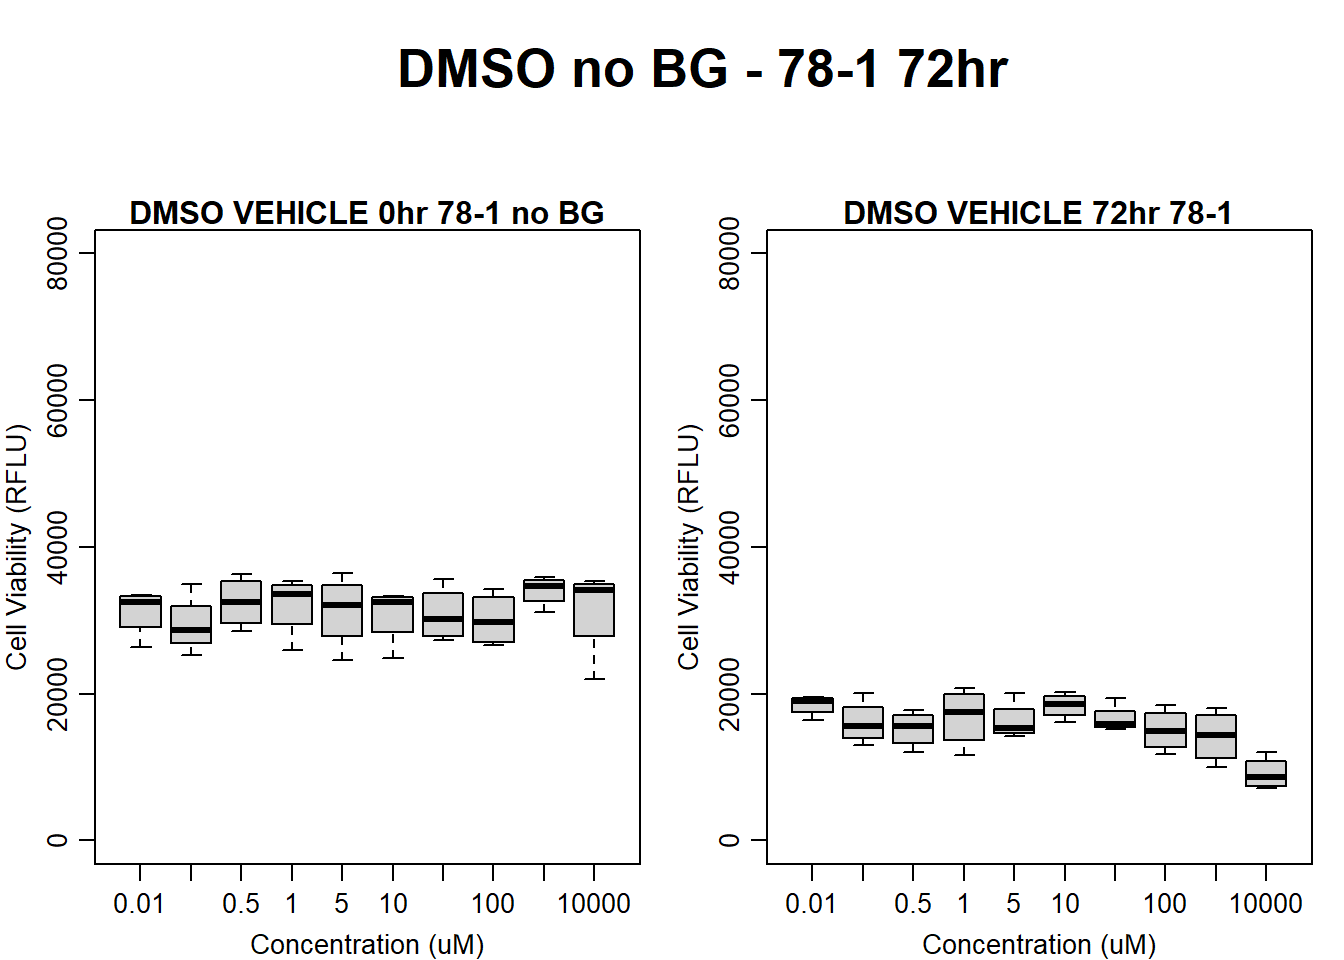
#####DMSO samples#####
#DMSO 78-1 72HR
par(mar = c(3.0, 3.0, 1.2, 1), mgp = c(2, .7, 0))
layout(matrix(c(1, 2, 1, 3), nrow = 2, ncol = 2), heights = c(0.5, 2, 2, 2))
#layout.show(3)
plot.new()
text(0.5,0.5,"DMSO no BG - 78-1 72hr",cex = 2,font = 2)

boxplot(dmso72hr78$Ind2_78_In_noBG ~ dmso72hr78$Conc,
        ylim = c(0, 80000),
        ylab = "Cell Viability (RFLU)",
        xlab = "Concentration (uM)",
        main = "DMSO VEHICLE 0hr 78-1 no BG"
)

boxplot(dmso72hr78$Ind2_78_Fin_noBG ~ dmso72hr78$Conc,
        ylim = c(0,80000),
        ylab = "Cell Viability (RFLU)",
        xlab = "Concentration (uM)",
        main = "DMSO VEHICLE 72hr 78-1"
)
| Version | Author | Date |
|---|---|---|
| 109e14b | emmapfort | 2025-03-03 |
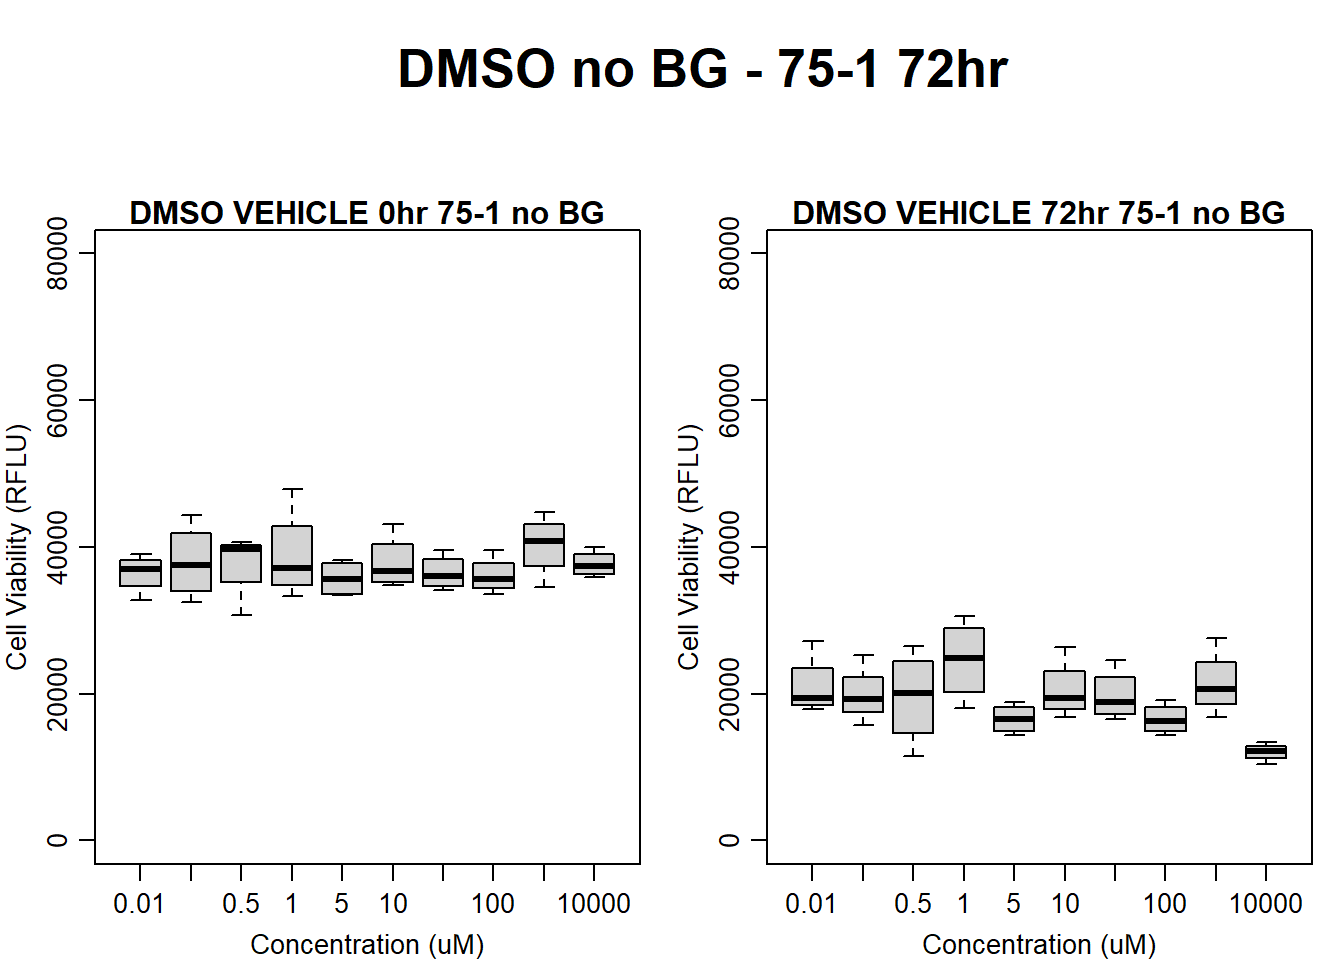
#DMSO 75-1 no BG 72HR
par(mar = c(3.0, 3.0, 1.2, 1), mgp = c(2, .7, 0))
layout(matrix(c(1, 2, 1, 3), nrow = 2, ncol = 2), heights = c(0.5, 2, 2, 2))
#layout.show(3)
plot.new()
text(0.5,0.5,"DMSO no BG - 75-1 72hr",cex = 2,font = 2)

boxplot(dmso72hr75$Ind1_75_In_noBG ~ dmso72hr75$Conc,
        ylim = c(0, 80000),
        ylab = "Cell Viability (RFLU)",
        xlab = "Concentration (uM)",
        main = "DMSO VEHICLE 0hr 75-1 no BG"
)

boxplot(dmso72hr75$Ind1_75_Fin_noBG ~ dmso72hr75$Conc,
        ylim = c(0,80000),
        ylab = "Cell Viability (RFLU)",
        xlab = "Concentration (uM)",
        main = "DMSO VEHICLE 72hr 75-1 no BG"
)
| Version | Author | Date |
|---|---|---|
| 109e14b | emmapfort | 2025-03-03 |
#DMSO 17-3 no BG 72HR
par(mar = c(3.0, 3.0, 1.2, 1), mgp = c(2, .7, 0))
layout(matrix(c(1, 2, 1, 3), nrow = 2, ncol = 2), heights = c(0.5, 2, 2, 2))
#layout.show(3)
plot.new()
text(0.5,0.5,"DMSO no BG - 17-3 72hr",cex = 2,font = 2)

boxplot(dmso72hr17$Ind3_17_In_noBG ~ dmso72hr17$Conc,
        ylim = c(0, 80000),
        ylab = "Cell Viability (RFLU)",
        xlab = "Concentration (uM)",
        main = "DMSO VEHICLE 0hr 17-3 no BG"
)

boxplot(dmso72hr17$Ind3_17_Fin_noBG ~ dmso72hr17$Conc,
        ylim = c(0,80000),
        ylab = "Cell Viability (RFLU)",
        xlab = "Concentration (uM)",
        main = "DMSO VEHICLE 72hr 17-3 no BG"
)
| Version | Author | Date |
|---|---|---|
| 109e14b | emmapfort | 2025-03-03 |
Now let’s plot the next step: subtracting the empty wells
#####DOX Samples#####
#dox 78-1 Empty Wells 24HR
par(mar = c(3.0, 3.0, 1.2, 1), mgp = c(2, .7, 0))
layout(matrix(c(1, 2, 1, 3), nrow = 2, ncol = 2), heights = c(0.5, 2, 2, 2))
#layout.show(3)
plot.new()
text(0.5,0.5,"DOX no BG Empty - 78-1 24hr",cex = 2,font = 2)

boxplot(dox24hr78$Ind2_78_In_noBG_Low ~ dox24hr78$Conc,
        ylim = c(0, 1.5),
        ylab = "Cell Viability (%)",
        xlab = "Concentration (uM)",
        main = "DOXORUBICIN 0hr 78-1 no BG Empty"
)

boxplot(dox24hr78$Ind2_78_Fin_noBG_Low ~ dox24hr78$Conc,
        ylim = c(0, 1.5),
        ylab = "Cell Viability (%)",
        xlab = "Concentration (uM)",
        main = "DOXORUBICIN 24hr 78-1 no BG"
)![]()
| Version | Author | Date |
|---|---|---|
| 109e14b | emmapfort | 2025-03-03 |
#dox 75-1 24HR
par(mar = c(3.0, 3.0, 1.2, 1), mgp = c(2, .7, 0))
layout(matrix(c(1, 2, 1, 3), nrow = 2, ncol = 2), heights = c(0.5, 2, 2, 2))
#layout.show(3)
plot.new()
text(0.5,0.5,"DOX no BG Empty - 75-1 24hr",cex = 2,font = 2)

boxplot(dox24hr75$Ind1_75_In_noBG_Low ~ dox24hr75$Conc,
        ylim = c(0, 1.5),
        ylab = "Cell Viability (%)",
        xlab = "Concentration (uM)",
        main = "DOXORUBICIN 0hr 75-1 no BG Empty"
)

boxplot(dox24hr75$Ind1_75_Fin_noBG_Low ~ dox24hr75$Conc,
        ylim = c(0, 1.5),
        ylab = "Cell Viability (%)",
        xlab = "Concentration (uM)",
        main = "DOXORUBICIN 24hr 75-1 no BG Empty"
)![]()
| Version | Author | Date |
|---|---|---|
| 109e14b | emmapfort | 2025-03-03 |
#dox 17-3 24HR
par(mar = c(3.0, 3.0, 1.2, 1), mgp = c(2, .7, 0))
layout(matrix(c(1, 2, 1, 3), nrow = 2, ncol = 2), heights = c(0.5, 2, 2, 2))
#layout.show(3)
plot.new()
text(0.5,0.5,"DOX no BG Empty - 17-3 24hr",cex = 2,font = 2)

boxplot(dox24hr17$Ind3_17_In_noBG_Low ~ dox24hr17$Conc,
        ylim = c(0, 1.5),
        ylab = "Cell Viability (%)",
        xlab = "Concentration (uM)",
        main = "DOXORUBICIN 0hr 17-3 no BG Empty"
)

boxplot(dox24hr17$Ind3_17_Fin_noBG_Low ~ dox24hr17$Conc,
        ylim = c(0, 1.5),
        ylab = "Cell Viability (%)",
        xlab = "Concentration (uM)",
        main = "DOXORUBICIN 24hr 17-3 no BG Empty"
)![]()
| Version | Author | Date |
|---|---|---|
| 109e14b | emmapfort | 2025-03-03 |
#####FLUO samples#####
#FLUO 78-1 no BG 24HR
par(mar = c(3.0, 3.0, 1.2, 1), mgp = c(2, .7, 0))
layout(matrix(c(1, 2, 1, 3), nrow = 2, ncol = 2), heights = c(0.5, 2, 2, 2))
#layout.show(3)
plot.new()
text(0.5,0.5,"FLUO no BG Empty - 78-1 24hr",cex = 2,font = 2)

boxplot(fluo24hr78$Ind2_78_In_noBG_Low ~ fluo24hr78$Conc,
        ylim = c(0, 1.5),
        ylab = "Cell Viability (%)",
        xlab = "Concentration (uM)",
        main = "5-FLUOROURACIL 0hr 78-1 no BG Empty"
)

boxplot(fluo24hr78$Ind2_78_Fin_noBG_Low ~ fluo24hr78$Conc,
        ylim = c(0, 1.5),
        ylab = "Cell Viability (%)",
        xlab = "Concentration (uM)",
        main = "5-FLUOROURACIL 24hr 78-1 no BG Empty"
)![]()
| Version | Author | Date |
|---|---|---|
| 109e14b | emmapfort | 2025-03-03 |
#FLUO 75-1 no BG Empty 24HR
par(mar = c(3.0, 3.0, 1.2, 1), mgp = c(2, .7, 0))
layout(matrix(c(1, 2, 1, 3), nrow = 2, ncol = 2), heights = c(0.5, 2, 2, 2))
#layout.show(3)
plot.new()
text(0.5,0.5,"FLUO no BG Empty - 75-1 24hr",cex = 2,font = 2)

boxplot(fluo24hr75$Ind1_75_In_noBG_Low ~ fluo24hr75$Conc,
        ylim = c(0, 1.5),
        ylab = "Cell Viability (%)",
        xlab = "Concentration (uM)",
        main = "5-FLUOROURACIL 0hr 75-1 no BG Empty"
)

boxplot(fluo24hr75$Ind1_75_Fin_noBG_Low ~ fluo24hr75$Conc,
        ylim = c(0, 1.5),
        ylab = "Cell Viability (%)",
        xlab = "Concentration (uM)",
        main = "5-FLUOROURACIL 24hr 75-1 no BG Empty"
)![]()
| Version | Author | Date |
|---|---|---|
| 109e14b | emmapfort | 2025-03-03 |
#FLUO 17-3 no BG Empty 24HR
par(mar = c(3.0, 3.0, 1.2, 1), mgp = c(2, .7, 0))
layout(matrix(c(1, 2, 1, 3), nrow = 2, ncol = 2), heights = c(0.5, 2, 2, 2))
#layout.show(3)
plot.new()
text(0.5,0.5,"FLUO no BG Empty - 17-3 24hr",cex = 2,font = 2)

boxplot(fluo24hr17$Ind3_17_In_noBG_Low ~ fluo24hr17$Conc,
        ylim = c(0, 1.5),
        ylab = "Cell Viability (%)",
        xlab = "Concentration (uM)",
        main = "5-FLUOROURACIL 0hr 17-3 no BG Empty"
)

boxplot(fluo24hr17$Ind3_17_Fin_noBG_Low ~ fluo24hr17$Conc,
        ylim = c(0, 1.5),
        ylab = "Cell Viability (%)",
        xlab = "Concentration (uM)",
        main = "5-FLUOROURACIL 24hr 17-3 no BG Empty"
)![]()
| Version | Author | Date |
|---|---|---|
| 109e14b | emmapfort | 2025-03-03 |
#####DMSO samples#####
#DMSO 78-1 24HR
par(mar = c(3.0, 3.0, 1.2, 1), mgp = c(2, .7, 0))
layout(matrix(c(1, 2, 1, 3), nrow = 2, ncol = 2), heights = c(0.5, 2, 2, 2))
#layout.show(3)
plot.new()
text(0.5,0.5,"DMSO no BG Empty - 78-1 24hr",cex = 2,font = 2)

boxplot(dmso24hr78$Ind2_78_In_noBG_Low ~ dmso24hr78$Conc,
        ylim = c(0, 1.5),
        ylab = "Cell Viability (%)",
        xlab = "Concentration (uM)",
        main = "DMSO VEHICLE 0hr 78-1 no BG Empty"
)

boxplot(dmso24hr78$Ind2_78_Fin_noBG_Low ~ dmso24hr78$Conc,
        ylim = c(0, 1.5),
        ylab = "Cell Viability (%)",
        xlab = "Concentration (uM)",
        main = "DMSO VEHICLE 24hr 78-1 no BG Empty"
)![]()
| Version | Author | Date |
|---|---|---|
| 109e14b | emmapfort | 2025-03-03 |
#DMSO 75-1 no BG Empty 24HR
par(mar = c(3.0, 3.0, 1.2, 1), mgp = c(2, .7, 0))
layout(matrix(c(1, 2, 1, 3), nrow = 2, ncol = 2), heights = c(0.5, 2, 2, 2))
#layout.show(3)
plot.new()
text(0.5,0.5,"DMSO no BG Empty - 75-1 24hr",cex = 2,font = 2)

boxplot(dmso24hr75$Ind1_75_In_noBG_Low ~ dmso24hr75$Conc,
        ylim = c(0, 1.5),
        ylab = "Cell Viability (%)",
        xlab = "Concentration (uM)",
        main = "DMSO VEHICLE 0hr 75-1 no BG Empty"
)

boxplot(dmso24hr75$Ind1_75_Fin_noBG_Low ~ dmso24hr75$Conc,
        ylim = c(0, 1.5),
        ylab = "Cell Viability (%)",
        xlab = "Concentration (uM)",
        main = "DMSO VEHICLE 24hr 75-1 no BG Empty"
)![]()
| Version | Author | Date |
|---|---|---|
| 109e14b | emmapfort | 2025-03-03 |
#DMSO 17-3 no BG Empty 24HR
par(mar = c(3.0, 3.0, 1.2, 1), mgp = c(2, .7, 0))
layout(matrix(c(1, 2, 1, 3), nrow = 2, ncol = 2), heights = c(0.5, 2, 2, 2))
#layout.show(3)
plot.new()
text(0.5,0.5,"DMSO no BG Empty - 17-3 24hr",cex = 2,font = 2)

boxplot(dmso24hr17$Ind3_17_In_noBG_Low ~ dmso24hr17$Conc,
        ylim = c(0, 1.5),
        ylab = "Cell Viability (%)",
        xlab = "Concentration (uM)",
        main = "DMSO VEHICLE 0hr 17-3 no BG Empty"
)

boxplot(dmso24hr17$Ind3_17_Fin_noBG_Low ~ dmso24hr17$Conc,
        ylim = c(0, 1.5),
        ylab = "Cell Viability (%)",
        xlab = "Concentration (uM)",
        main = "DMSO VEHICLE 24hr 17-3 no BG Empty"
)![]()
| Version | Author | Date |
|---|---|---|
| 109e14b | emmapfort | 2025-03-03 |
#####DOX Samples#####
#dox 78-1 Empty Wells 48HR
par(mar = c(3.0, 3.0, 1.2, 1), mgp = c(2, .7, 0))
layout(matrix(c(1, 2, 1, 3), nrow = 2, ncol = 2), heights = c(0.5, 2, 2, 2))
#layout.show(3)
plot.new()
text(0.5,0.5,"DOX no BG Empty - 78-1 48hr",cex = 2,font = 2)

boxplot(dox48hr78$Ind2_78_In_noBG_Low ~ dox48hr78$Conc,
        ylim = c(0, 1.5),
        ylab = "Cell Viability (%)",
        xlab = "Concentration (uM)",
        main = "DOXORUBICIN 0hr 78-1 no BG Empty"
)

boxplot(dox48hr78$Ind2_78_Fin_noBG_Low ~ dox48hr78$Conc,
        ylim = c(0, 1.5),
        ylab = "Cell Viability (%)",
        xlab = "Concentration (uM)",
        main = "DOXORUBICIN 48hr 78-1 no BG"
)![]()
| Version | Author | Date |
|---|---|---|
| 109e14b | emmapfort | 2025-03-03 |
#dox 75-1 48HR
par(mar = c(3.0, 3.0, 1.2, 1), mgp = c(2, .7, 0))
layout(matrix(c(1, 2, 1, 3), nrow = 2, ncol = 2), heights = c(0.5, 2, 2, 2))
#layout.show(3)
plot.new()
text(0.5,0.5,"DOX no BG Empty - 75-1 48hr",cex = 2,font = 2)

boxplot(dox48hr75$Ind1_75_In_noBG_Low ~ dox48hr75$Conc,
        ylim = c(0, 1.5),
        ylab = "Cell Viability (%)",
        xlab = "Concentration (uM)",
        main = "DOXORUBICIN 0hr 75-1 no BG Empty"
)

boxplot(dox48hr75$Ind1_75_Fin_noBG_Low ~ dox48hr75$Conc,
        ylim = c(0, 1.5),
        ylab = "Cell Viability (%)",
        xlab = "Concentration (uM)",
        main = "DOXORUBICIN 48hr 75-1 no BG Empty"
)![]()
| Version | Author | Date |
|---|---|---|
| 109e14b | emmapfort | 2025-03-03 |
#dox 17-3 48HR
par(mar = c(3.0, 3.0, 1.2, 1), mgp = c(2, .7, 0))
layout(matrix(c(1, 2, 1, 3), nrow = 2, ncol = 2), heights = c(0.5, 2, 2, 2))
#layout.show(3)
plot.new()
text(0.5,0.5,"DOX no BG Empty - 17-3 48hr",cex = 2,font = 2)

boxplot(dox48hr17$Ind3_17_In_noBG_Low ~ dox48hr17$Conc,
        ylim = c(0, 1.5),
        ylab = "Cell Viability (%)",
        xlab = "Concentration (uM)",
        main = "DOXORUBICIN 0hr 17-3 no BG Empty"
)

boxplot(dox48hr17$Ind3_17_Fin_noBG_Low ~ dox48hr17$Conc,
        ylim = c(0, 1.5),
        ylab = "Cell Viability (%)",
        xlab = "Concentration (uM)",
        main = "DOXORUBICIN 48hr 17-3 no BG Empty"
)![]()
| Version | Author | Date |
|---|---|---|
| 109e14b | emmapfort | 2025-03-03 |
#####FLUO samples#####
#FLUO 78-1 no BG 48HR
par(mar = c(3.0, 3.0, 1.2, 1), mgp = c(2, .7, 0))
layout(matrix(c(1, 2, 1, 3), nrow = 2, ncol = 2), heights = c(0.5, 2, 2, 2))
#layout.show(3)
plot.new()
text(0.5,0.5,"FLUO no BG Empty - 78-1 48hr",cex = 2,font = 2)

boxplot(fluo48hr78$Ind2_78_In_noBG_Low ~ fluo48hr78$Conc,
        ylim = c(0, 1.5),
        ylab = "Cell Viability (%)",
        xlab = "Concentration (uM)",
        main = "5-FLUOROURACIL 0hr 78-1 no BG Empty"
)

boxplot(fluo48hr78$Ind2_78_Fin_noBG_Low ~ fluo48hr78$Conc,
        ylim = c(0, 1.5),
        ylab = "Cell Viability (%)",
        xlab = "Concentration (uM)",
        main = "5-FLUOROURACIL 48hr 78-1 no BG Empty"
)![]()
| Version | Author | Date |
|---|---|---|
| 109e14b | emmapfort | 2025-03-03 |
#FLUO 75-1 no BG Empty 48HR
par(mar = c(3.0, 3.0, 1.2, 1), mgp = c(2, .7, 0))
layout(matrix(c(1, 2, 1, 3), nrow = 2, ncol = 2), heights = c(0.5, 2, 2, 2))
#layout.show(3)
plot.new()
text(0.5,0.5,"FLUO no BG Empty - 75-1 48hr",cex = 2,font = 2)

boxplot(fluo48hr75$Ind1_75_In_noBG_Low ~ fluo48hr75$Conc,
        ylim = c(0, 1.5),
        ylab = "Cell Viability (%)",
        xlab = "Concentration (uM)",
        main = "5-FLUOROURACIL 0hr 75-1 no BG Empty"
)

boxplot(fluo48hr75$Ind1_75_Fin_noBG_Low ~ fluo48hr75$Conc,
        ylim = c(0, 1.5),
        ylab = "Cell Viability (%)",
        xlab = "Concentration (uM)",
        main = "5-FLUOROURACIL 48hr 75-1 no BG Empty"
)![]()
| Version | Author | Date |
|---|---|---|
| 109e14b | emmapfort | 2025-03-03 |
#FLUO 17-3 no BG Empty 48HR
par(mar = c(3.0, 3.0, 1.2, 1), mgp = c(2, .7, 0))
layout(matrix(c(1, 2, 1, 3), nrow = 2, ncol = 2), heights = c(0.5, 2, 2, 2))
#layout.show(3)
plot.new()
text(0.5,0.5,"FLUO no BG Empty - 17-3 48hr",cex = 2,font = 2)

boxplot(fluo48hr17$Ind3_17_In_noBG_Low ~ fluo48hr17$Conc,
        ylim = c(0, 1.5),
        ylab = "Cell Viability (%)",
        xlab = "Concentration (uM)",
        main = "5-FLUOROURACIL 0hr 17-3 no BG Empty"
)

boxplot(fluo48hr17$Ind3_17_Fin_noBG_Low ~ fluo48hr17$Conc,
        ylim = c(0, 1.5),
        ylab = "Cell Viability (%)",
        xlab = "Concentration (uM)",
        main = "5-FLUOROURACIL 48hr 17-3 no BG Empty"
)![]()
| Version | Author | Date |
|---|---|---|
| 109e14b | emmapfort | 2025-03-03 |
#####DMSO samples#####
#DMSO 78-1 48HR
par(mar = c(3.0, 3.0, 1.2, 1), mgp = c(2, .7, 0))
layout(matrix(c(1, 2, 1, 3), nrow = 2, ncol = 2), heights = c(0.5, 2, 2, 2))
#layout.show(3)
plot.new()
text(0.5,0.5,"DMSO no BG Empty - 78-1 48hr",cex = 2,font = 2)

boxplot(dmso48hr78$Ind2_78_In_noBG_Low ~ dmso48hr78$Conc,
        ylim = c(0, 1.5),
        ylab = "Cell Viability (%)",
        xlab = "Concentration (uM)",
        main = "DMSO VEHICLE 0hr 78-1 no BG Empty"
)

boxplot(dmso48hr78$Ind2_78_Fin_noBG_Low ~ dmso48hr78$Conc,
        ylim = c(0, 1.5),
        ylab = "Cell Viability (%)",
        xlab = "Concentration (uM)",
        main = "DMSO VEHICLE 48hr 78-1 no BG Empty"
)![]()
| Version | Author | Date |
|---|---|---|
| 109e14b | emmapfort | 2025-03-03 |
#DMSO 75-1 no BG Empty 48HR
par(mar = c(3.0, 3.0, 1.2, 1), mgp = c(2, .7, 0))
layout(matrix(c(1, 2, 1, 3), nrow = 2, ncol = 2), heights = c(0.5, 2, 2, 2))
#layout.show(3)
plot.new()
text(0.5,0.5,"DMSO no BG Empty - 75-1 48hr",cex = 2,font = 2)

boxplot(dmso48hr75$Ind1_75_In_noBG_Low ~ dmso48hr75$Conc,
        ylim = c(0, 1.5),
        ylab = "Cell Viability (%)",
        xlab = "Concentration (uM)",
        main = "DMSO VEHICLE 0hr 75-1 no BG Empty"
)

boxplot(dmso48hr75$Ind1_75_Fin_noBG_Low ~ dmso48hr75$Conc,
        ylim = c(0, 1.5),
        ylab = "Cell Viability (%)",
        xlab = "Concentration (uM)",
        main = "DMSO VEHICLE 48hr 75-1 no BG Empty"
)![]()
| Version | Author | Date |
|---|---|---|
| 109e14b | emmapfort | 2025-03-03 |
#DMSO 17-3 no BG Empty 48HR
par(mar = c(3.0, 3.0, 1.2, 1), mgp = c(2, .7, 0))
layout(matrix(c(1, 2, 1, 3), nrow = 2, ncol = 2), heights = c(0.5, 2, 2, 2))
#layout.show(3)
plot.new()
text(0.5,0.5,"DMSO no BG Empty - 17-3 48hr",cex = 2,font = 2)

boxplot(dmso48hr17$Ind3_17_In_noBG_Low ~ dmso48hr17$Conc,
        ylim = c(0, 1.5),
        ylab = "Cell Viability (%)",
        xlab = "Concentration (uM)",
        main = "DMSO VEHICLE 0hr 17-3 no BG Empty"
)

boxplot(dmso48hr17$Ind3_17_Fin_noBG_Low ~ dmso48hr17$Conc,
        ylim = c(0, 1.5),
        ylab = "Cell Viability (%)",
        xlab = "Concentration (uM)",
        main = "DMSO VEHICLE 48hr 17-3 no BG Empty"
)![]()
| Version | Author | Date |
|---|---|---|
| 109e14b | emmapfort | 2025-03-03 |
#####DOX Samples#####
#dox 78-1 Empty Wells 72HR
par(mar = c(3.0, 3.0, 1.2, 1), mgp = c(2, .7, 0))
layout(matrix(c(1, 2, 1, 3), nrow = 2, ncol = 2), heights = c(0.5, 2, 2, 2))
#layout.show(3)
plot.new()
text(0.5,0.5,"DOX no BG Empty - 78-1 72hr",cex = 2,font = 2)

boxplot(dox72hr78$Ind2_78_In_noBG_Low ~ dox72hr78$Conc,
        ylim = c(0, 1.5),
        ylab = "Cell Viability (%)",
        xlab = "Concentration (uM)",
        main = "DOXORUBICIN 0hr 78-1 no BG Empty"
)

boxplot(dox72hr78$Ind2_78_Fin_noBG_Low ~ dox72hr78$Conc,
        ylim = c(0, 1.5),
        ylab = "Cell Viability (%)",
        xlab = "Concentration (uM)",
        main = "DOXORUBICIN 72hr 78-1 no BG"
)![]()
| Version | Author | Date |
|---|---|---|
| 109e14b | emmapfort | 2025-03-03 |
#dox 75-1 72HR
par(mar = c(3.0, 3.0, 1.2, 1), mgp = c(2, .7, 0))
layout(matrix(c(1, 2, 1, 3), nrow = 2, ncol = 2), heights = c(0.5, 2, 2, 2))
#layout.show(3)
plot.new()
text(0.5,0.5,"DOX no BG Empty - 75-1 72hr",cex = 2,font = 2)

boxplot(dox72hr75$Ind1_75_In_noBG_Low ~ dox72hr75$Conc,
        ylim = c(0, 1.5),
        ylab = "Cell Viability (%)",
        xlab = "Concentration (uM)",
        main = "DOXORUBICIN 0hr 75-1 no BG Empty"
)

boxplot(dox72hr75$Ind1_75_Fin_noBG_Low ~ dox72hr75$Conc,
        ylim = c(0, 1.5),
        ylab = "Cell Viability (%)",
        xlab = "Concentration (uM)",
        main = "DOXORUBICIN 72hr 75-1 no BG Empty"
)![]()
| Version | Author | Date |
|---|---|---|
| 109e14b | emmapfort | 2025-03-03 |
#dox 17-3 72HR
par(mar = c(3.0, 3.0, 1.2, 1), mgp = c(2, .7, 0))
layout(matrix(c(1, 2, 1, 3), nrow = 2, ncol = 2), heights = c(0.5, 2, 2, 2))
#layout.show(3)
plot.new()
text(0.5,0.5,"DOX no BG Empty - 17-3 72hr",cex = 2,font = 2)

boxplot(dox72hr17$Ind3_17_In_noBG_Low ~ dox72hr17$Conc,
        ylim = c(0, 1.5),
        ylab = "Cell Viability (%)",
        xlab = "Concentration (uM)",
        main = "DOXORUBICIN 0hr 17-3 no BG Empty"
)

boxplot(dox72hr17$Ind3_17_Fin_noBG_Low ~ dox72hr17$Conc,
        ylim = c(0, 1.5),
        ylab = "Cell Viability (%)",
        xlab = "Concentration (uM)",
        main = "DOXORUBICIN 72hr 17-3 no BG Empty"
)![]()
| Version | Author | Date |
|---|---|---|
| 109e14b | emmapfort | 2025-03-03 |
#####FLUO samples#####
#FLUO 78-1 no BG 72HR
par(mar = c(3.0, 3.0, 1.2, 1), mgp = c(2, .7, 0))
layout(matrix(c(1, 2, 1, 3), nrow = 2, ncol = 2), heights = c(0.5, 2, 2, 2))
#layout.show(3)
plot.new()
text(0.5,0.5,"FLUO no BG Empty - 78-1 72hr",cex = 2,font = 2)

boxplot(fluo72hr78$Ind2_78_In_noBG_Low ~ fluo72hr78$Conc,
        ylim = c(0, 1.5),
        ylab = "Cell Viability (%)",
        xlab = "Concentration (uM)",
        main = "5-FLUOROURACIL 0hr 78-1 no BG Empty"
)

boxplot(fluo72hr78$Ind2_78_Fin_noBG_Low ~ fluo72hr78$Conc,
        ylim = c(0, 1.5),
        ylab = "Cell Viability (%)",
        xlab = "Concentration (uM)",
        main = "5-FLUOROURACIL 72hr 78-1 no BG Empty"
)![]()
| Version | Author | Date |
|---|---|---|
| 109e14b | emmapfort | 2025-03-03 |
#FLUO 75-1 no BG Empty 72HR
par(mar = c(3.0, 3.0, 1.2, 1), mgp = c(2, .7, 0))
layout(matrix(c(1, 2, 1, 3), nrow = 2, ncol = 2), heights = c(0.5, 2, 2, 2))
#layout.show(3)
plot.new()
text(0.5,0.5,"FLUO no BG Empty - 75-1 72hr",cex = 2,font = 2)

boxplot(fluo72hr75$Ind1_75_In_noBG_Low ~ fluo72hr75$Conc,
        ylim = c(0, 1.5),
        ylab = "Cell Viability (%)",
        xlab = "Concentration (uM)",
        main = "5-FLUOROURACIL 0hr 75-1 no BG Empty"
)

boxplot(fluo72hr75$Ind1_75_Fin_noBG_Low ~ fluo72hr75$Conc,
        ylim = c(0, 1.5),
        ylab = "Cell Viability (%)",
        xlab = "Concentration (uM)",
        main = "5-FLUOROURACIL 72hr 75-1 no BG Empty"
)![]()
| Version | Author | Date |
|---|---|---|
| 109e14b | emmapfort | 2025-03-03 |
#FLUO 17-3 no BG Empty 72HR
par(mar = c(3.0, 3.0, 1.2, 1), mgp = c(2, .7, 0))
layout(matrix(c(1, 2, 1, 3), nrow = 2, ncol = 2), heights = c(0.5, 2, 2, 2))
#layout.show(3)
plot.new()
text(0.5,0.5,"FLUO no BG Empty - 17-3 72hr",cex = 2,font = 2)

boxplot(fluo72hr17$Ind3_17_In_noBG_Low ~ fluo72hr17$Conc,
        ylim = c(0, 1.5),
        ylab = "Cell Viability (%)",
        xlab = "Concentration (uM)",
        main = "5-FLUOROURACIL 0hr 17-3 no BG Empty"
)

boxplot(fluo72hr17$Ind3_17_Fin_noBG_Low ~ fluo72hr17$Conc,
        ylim = c(0, 1.5),
        ylab = "Cell Viability (%)",
        xlab = "Concentration (uM)",
        main = "5-FLUOROURACIL 72hr 17-3 no BG Empty"
)![]()
| Version | Author | Date |
|---|---|---|
| 109e14b | emmapfort | 2025-03-03 |
#####DMSO samples#####
#DMSO 78-1 72HR
par(mar = c(3.0, 3.0, 1.2, 1), mgp = c(2, .7, 0))
layout(matrix(c(1, 2, 1, 3), nrow = 2, ncol = 2), heights = c(0.5, 2, 2, 2))
#layout.show(3)
plot.new()
text(0.5,0.5,"DMSO no BG Empty - 78-1 72hr",cex = 2,font = 2)

boxplot(dmso72hr78$Ind2_78_In_noBG_Low ~ dmso72hr78$Conc,
        ylim = c(0, 1.5),
        ylab = "Cell Viability (%)",
        xlab = "Concentration (uM)",
        main = "DMSO VEHICLE 0hr 78-1 no BG Empty"
)

boxplot(dmso72hr78$Ind2_78_Fin_noBG_Low ~ dmso72hr78$Conc,
        ylim = c(0, 1.5),
        ylab = "Cell Viability (%)",
        xlab = "Concentration (uM)",
        main = "DMSO VEHICLE 72hr 78-1 no BG Empty"
)![]()
| Version | Author | Date |
|---|---|---|
| 109e14b | emmapfort | 2025-03-03 |
#DMSO 75-1 no BG Empty 72HR
par(mar = c(3.0, 3.0, 1.2, 1), mgp = c(2, .7, 0))
layout(matrix(c(1, 2, 1, 3), nrow = 2, ncol = 2), heights = c(0.5, 2, 2, 2))
#layout.show(3)
plot.new()
text(0.5,0.5,"DMSO no BG Empty - 75-1 72hr",cex = 2,font = 2)

boxplot(dmso72hr75$Ind1_75_In_noBG_Low ~ dmso72hr75$Conc,
        ylim = c(0, 1.5),
        ylab = "Cell Viability (%)",
        xlab = "Concentration (uM)",
        main = "DMSO VEHICLE 0hr 75-1 no BG Empty"
)

boxplot(dmso72hr75$Ind1_75_Fin_noBG_Low ~ dmso72hr75$Conc,
        ylim = c(0, 1.5),
        ylab = "Cell Viability (%)",
        xlab = "Concentration (uM)",
        main = "DMSO VEHICLE 72hr 75-1 no BG Empty"
)![]()
| Version | Author | Date |
|---|---|---|
| 109e14b | emmapfort | 2025-03-03 |
#DMSO 17-3 no BG Empty 72HR
par(mar = c(3.0, 3.0, 1.2, 1), mgp = c(2, .7, 0))
layout(matrix(c(1, 2, 1, 3), nrow = 2, ncol = 2), heights = c(0.5, 2, 2, 2))
#layout.show(3)
plot.new()
text(0.5,0.5,"DMSO no BG Empty - 17-3 72hr",cex = 2,font = 2)

boxplot(dmso72hr17$Ind3_17_In_noBG_Low ~ dmso72hr17$Conc,
        ylim = c(0, 1.5),
        ylab = "Cell Viability (%)",
        xlab = "Concentration (uM)",
        main = "DMSO VEHICLE 0hr 17-3 no BG Empty"
)

boxplot(dmso72hr17$Ind3_17_Fin_noBG_Low ~ dmso72hr17$Conc,
        ylim = c(0, 1.5),
        ylab = "Cell Viability (%)",
        xlab = "Concentration (uM)",
        main = "DMSO VEHICLE 72hr 17-3 no BG Empty"
)![]()
| Version | Author | Date |
|---|---|---|
| 109e14b | emmapfort | 2025-03-03 |
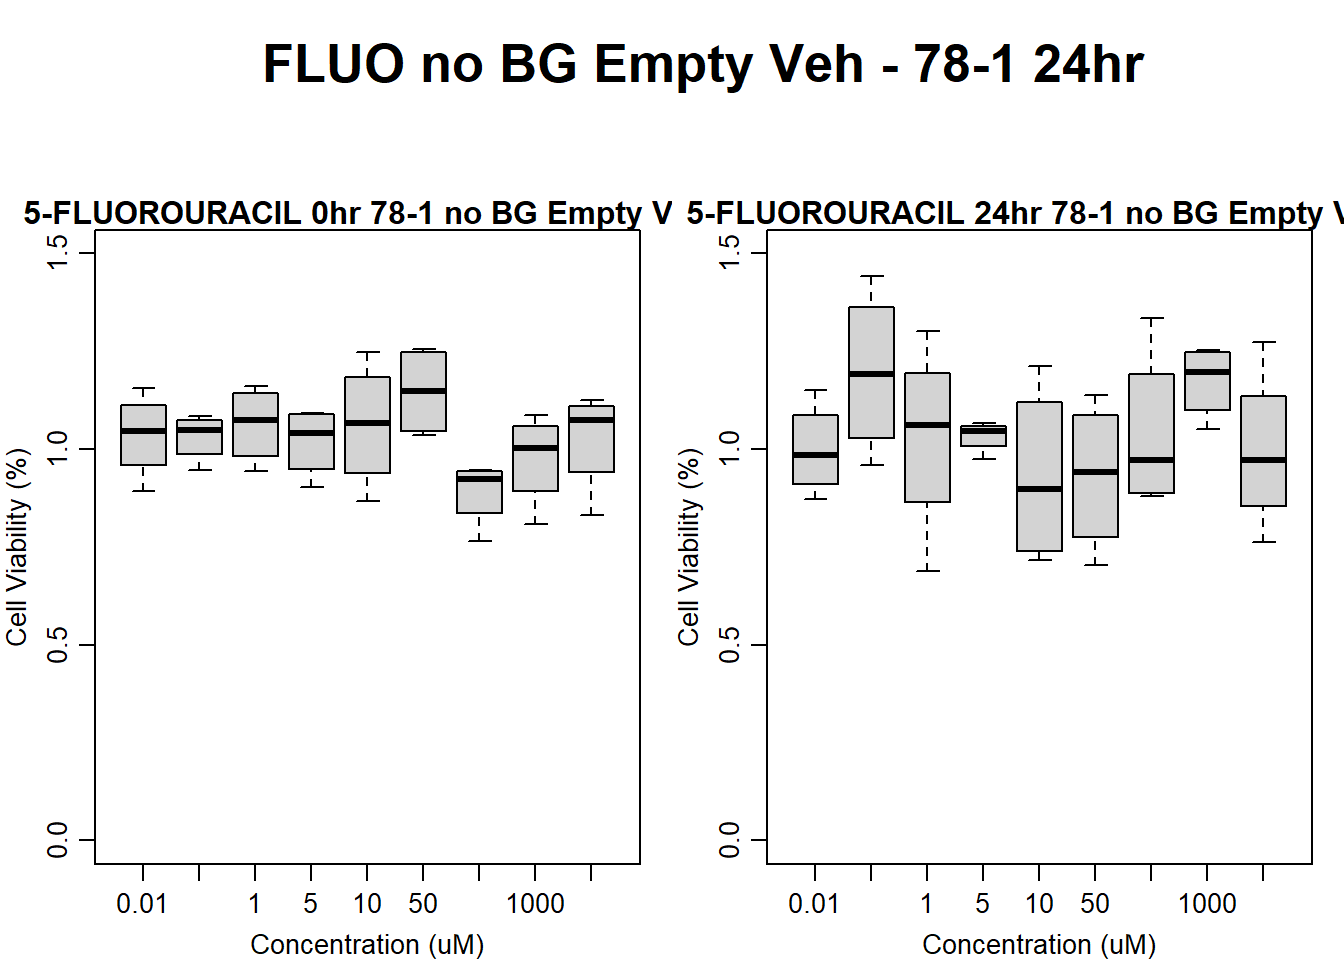
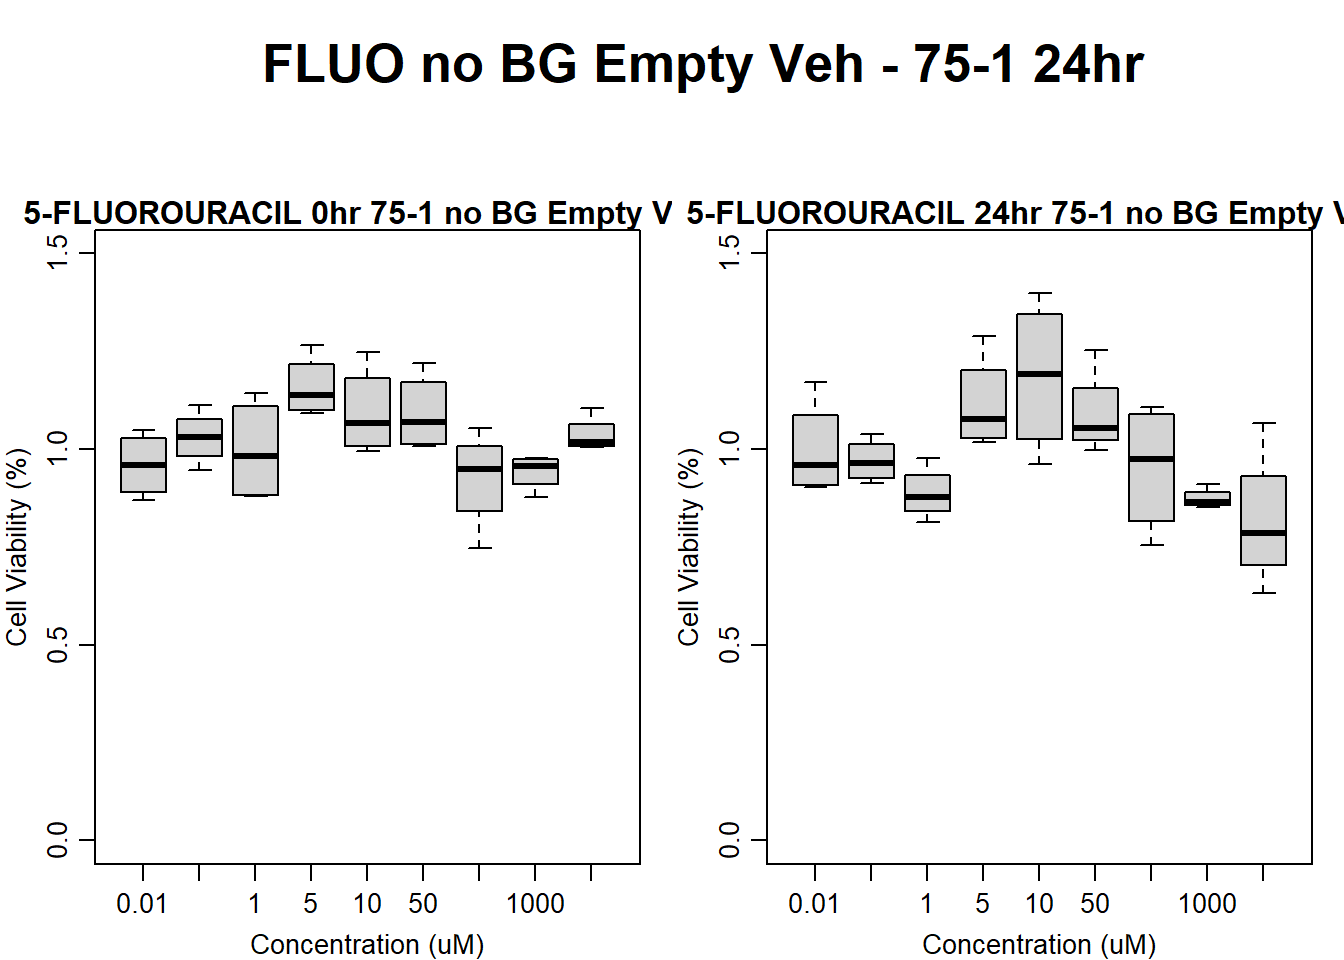
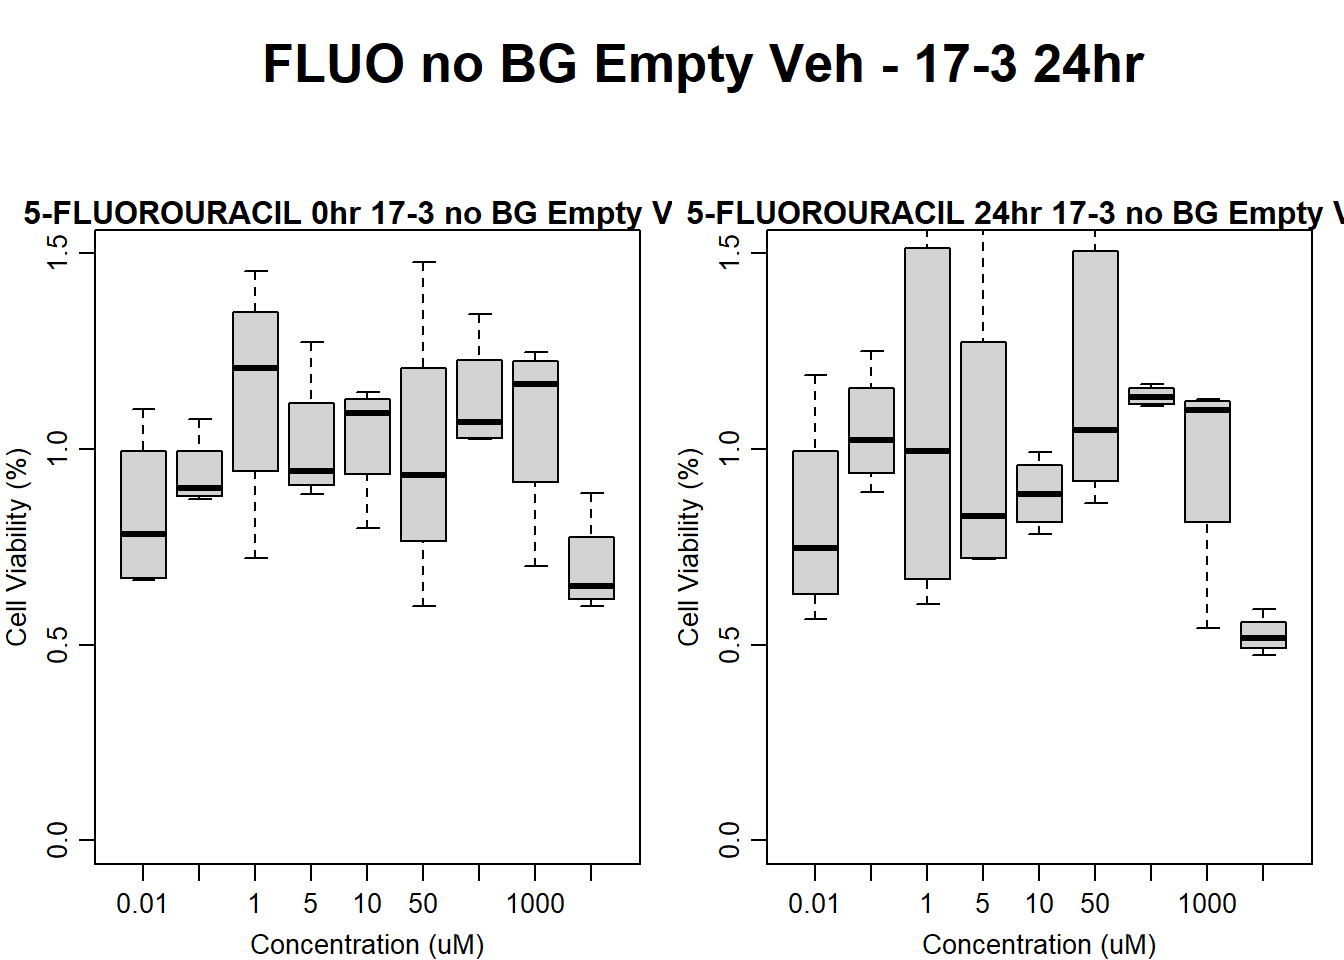
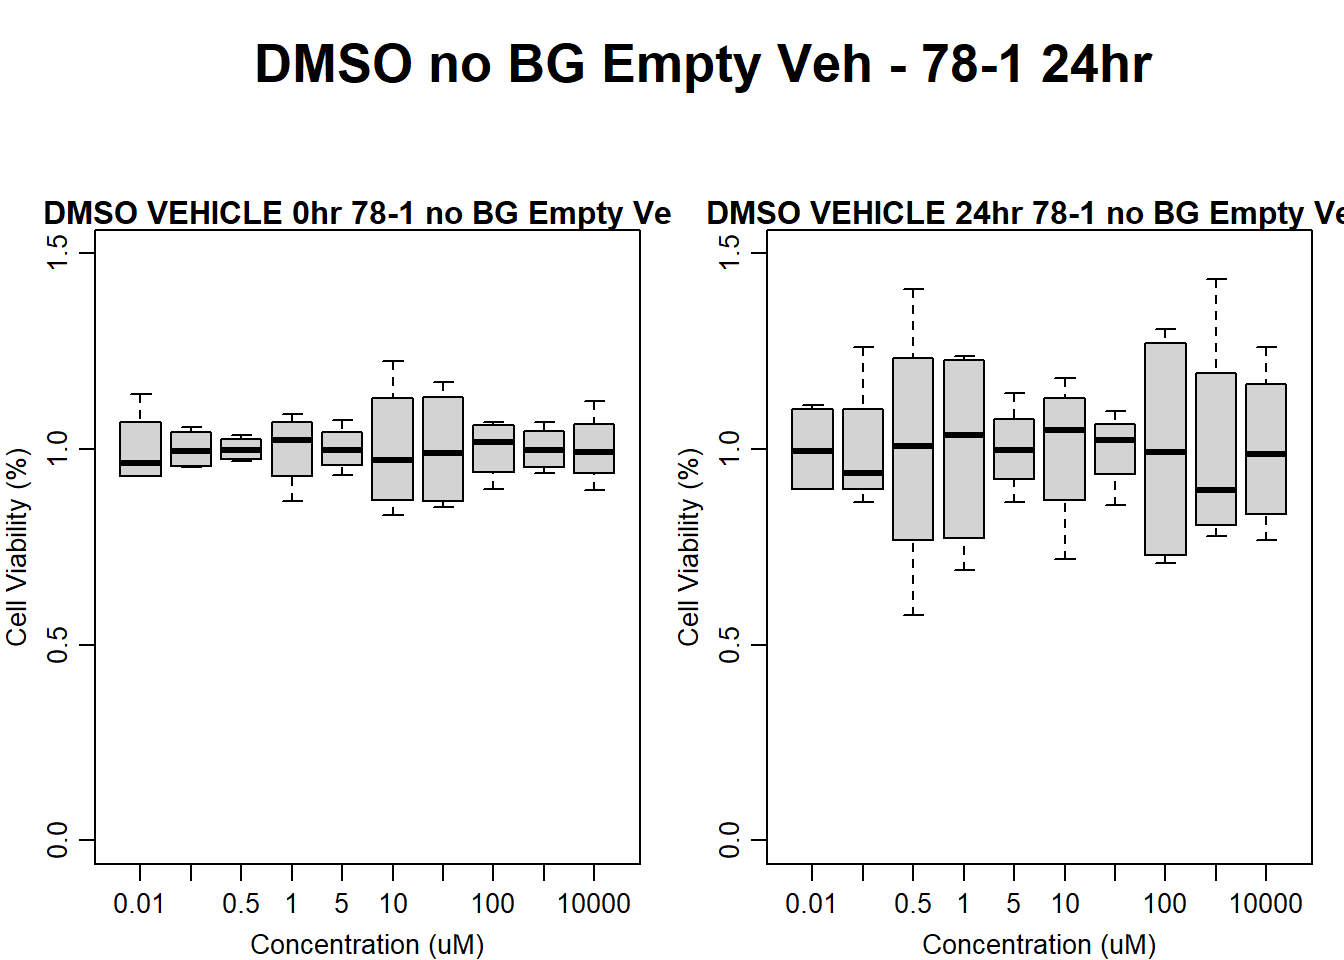
Now let’s plot the third step: dividing the matched vehicle values
#####DOX Samples#####
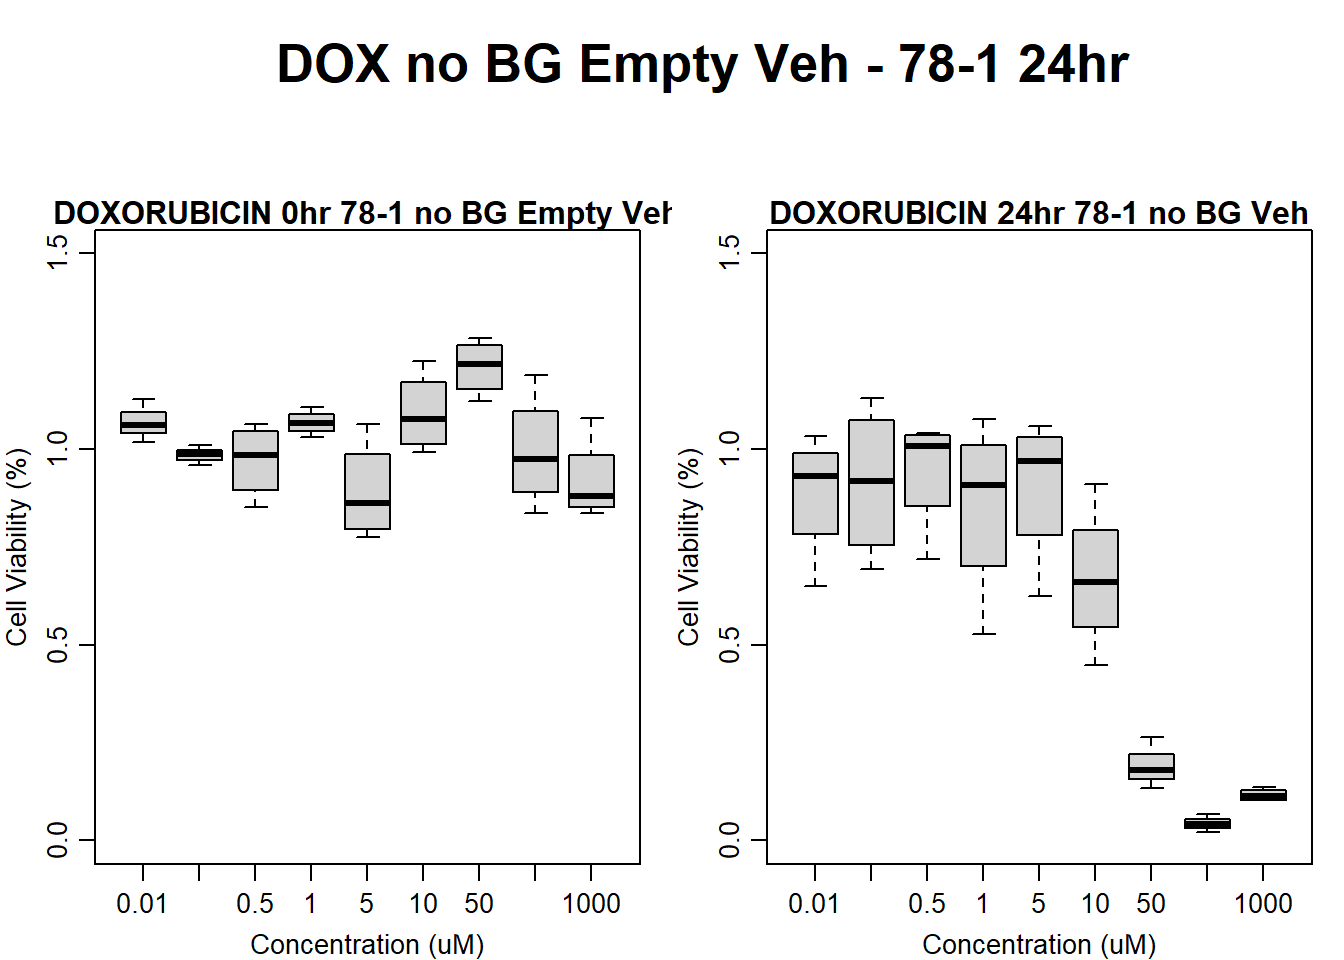
#dox 78-1 Veh 24HR
par(mar = c(3.0, 3.0, 1.2, 1), mgp = c(2, .7, 0))
layout(matrix(c(1, 2, 1, 3), nrow = 2, ncol = 2), heights = c(0.5, 2, 2, 2))
#layout.show(3)
plot.new()
text(0.5,0.5,"DOX no BG Empty Veh - 78-1 24hr",cex = 2,font = 2)
boxplot(dox24hr78$Ind2_78_In_noBG_Low_Veh ~ dox24hr78$Conc,
ylim = c(0, 1.5),
ylab = "Cell Viability (%)",
xlab = "Concentration (uM)",
main = "DOXORUBICIN 0hr 78-1 no BG Empty Veh"
)
boxplot(dox24hr78$Ind2_78_Fin_noBG_Low_Veh ~ dox24hr78$Conc,
ylim = c(0, 1.5),
ylab = "Cell Viability (%)",
xlab = "Concentration (uM)",
main = "DOXORUBICIN 24hr 78-1 no BG Veh"
)
| Version | Author | Date |
|---|---|---|
| 109e14b | emmapfort | 2025-03-03 |
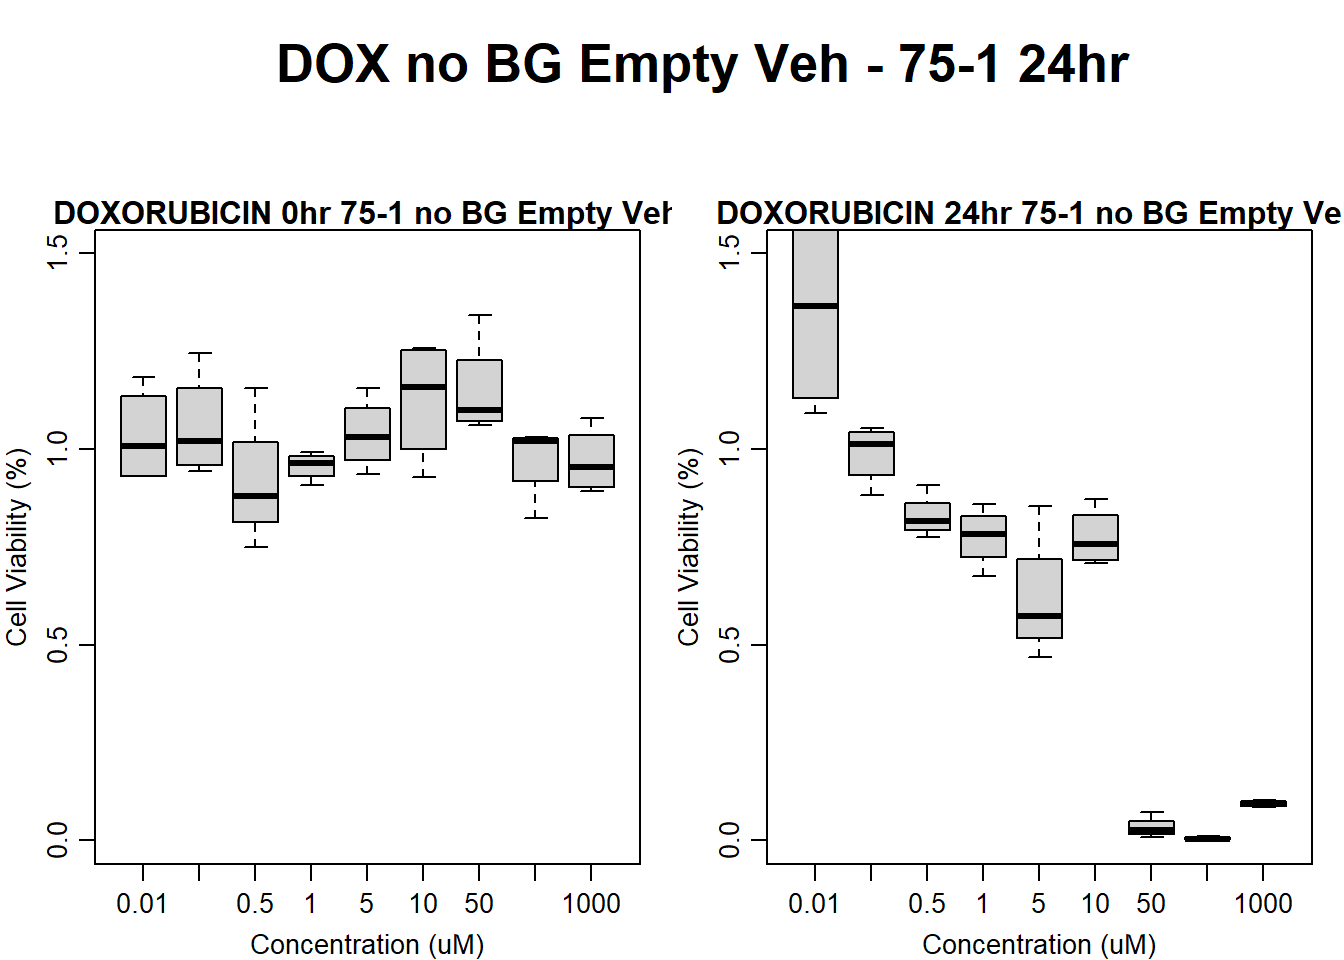
#dox 75-1 24HR
par(mar = c(3.0, 3.0, 1.2, 1), mgp = c(2, .7, 0))
layout(matrix(c(1, 2, 1, 3), nrow = 2, ncol = 2), heights = c(0.5, 2, 2, 2))
#layout.show(3)
plot.new()
text(0.5,0.5,"DOX no BG Empty Veh - 75-1 24hr",cex = 2,font = 2)

boxplot(dox24hr75$Ind1_75_In_noBG_Low_Veh ~ dox24hr75$Conc,
        ylim = c(0, 1.5),
        ylab = "Cell Viability (%)",
        xlab = "Concentration (uM)",
        main = "DOXORUBICIN 0hr 75-1 no BG Empty Veh"
)

boxplot(dox24hr75$Ind1_75_Fin_noBG_Low_Veh ~ dox24hr75$Conc,
        ylim = c(0, 1.5),
        ylab = "Cell Viability (%)",
        xlab = "Concentration (uM)",
        main = "DOXORUBICIN 24hr 75-1 no BG Empty Veh"
)
| Version | Author | Date |
|---|---|---|
| 109e14b | emmapfort | 2025-03-03 |
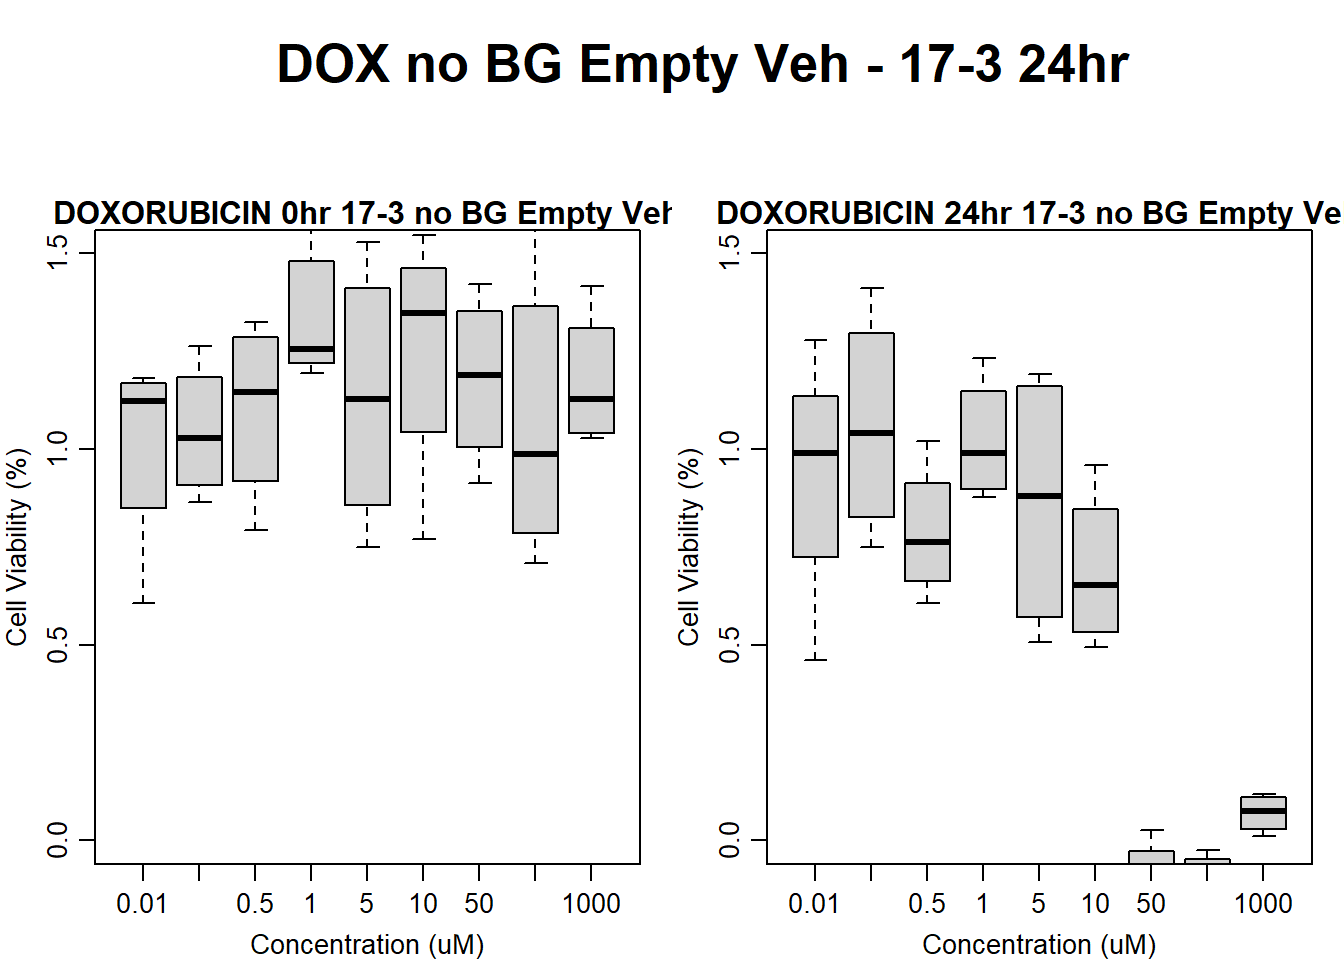
#dox 17-3 24HR
par(mar = c(3.0, 3.0, 1.2, 1), mgp = c(2, .7, 0))
layout(matrix(c(1, 2, 1, 3), nrow = 2, ncol = 2), heights = c(0.5, 2, 2, 2))
#layout.show(3)
plot.new()
text(0.5,0.5,"DOX no BG Empty Veh - 17-3 24hr",cex = 2,font = 2)

boxplot(dox24hr17$Ind3_17_In_noBG_Low_Veh ~ dox24hr17$Conc,
        ylim = c(0, 1.5),
        ylab = "Cell Viability (%)",
        xlab = "Concentration (uM)",
        main = "DOXORUBICIN 0hr 17-3 no BG Empty Veh"
)

boxplot(dox24hr17$Ind3_17_Fin_noBG_Low_Veh ~ dox24hr17$Conc,
        ylim = c(0, 1.5),
        ylab = "Cell Viability (%)",
        xlab = "Concentration (uM)",
        main = "DOXORUBICIN 24hr 17-3 no BG Empty Veh"
)
| Version | Author | Date |
|---|---|---|
| 109e14b | emmapfort | 2025-03-03 |
#####FLUO samples#####
#FLUO 78-1 no BG 24HR
par(mar = c(3.0, 3.0, 1.2, 1), mgp = c(2, .7, 0))
layout(matrix(c(1, 2, 1, 3), nrow = 2, ncol = 2), heights = c(0.5, 2, 2, 2))
#layout.show(3)
plot.new()
text(0.5,0.5,"FLUO no BG Empty Veh - 78-1 24hr",cex = 2,font = 2)

boxplot(fluo24hr78$Ind2_78_In_noBG_Low_Veh ~ fluo24hr78$Conc,
        ylim = c(0, 1.5),
        ylab = "Cell Viability (%)",
        xlab = "Concentration (uM)",
        main = "5-FLUOROURACIL 0hr 78-1 no BG Empty Veh"
)

boxplot(fluo24hr78$Ind2_78_Fin_noBG_Low_Veh ~ fluo24hr78$Conc,
        ylim = c(0, 1.5),
        ylab = "Cell Viability (%)",
        xlab = "Concentration (uM)",
        main = "5-FLUOROURACIL 24hr 78-1 no BG Empty Veh"
)
| Version | Author | Date |
|---|---|---|
| 109e14b | emmapfort | 2025-03-03 |
#FLUO 75-1 no BG Empty 24HR
par(mar = c(3.0, 3.0, 1.2, 1), mgp = c(2, .7, 0))
layout(matrix(c(1, 2, 1, 3), nrow = 2, ncol = 2), heights = c(0.5, 2, 2, 2))
#layout.show(3)
plot.new()
text(0.5,0.5,"FLUO no BG Empty Veh - 75-1 24hr",cex = 2,font = 2)

boxplot(fluo24hr75$Ind1_75_In_noBG_Low_Veh ~ fluo24hr75$Conc,
        ylim = c(0, 1.5),
        ylab = "Cell Viability (%)",
        xlab = "Concentration (uM)",
        main = "5-FLUOROURACIL 0hr 75-1 no BG Empty Veh"
)

boxplot(fluo24hr75$Ind1_75_Fin_noBG_Low_Veh ~ fluo24hr75$Conc,
        ylim = c(0, 1.5),
        ylab = "Cell Viability (%)",
        xlab = "Concentration (uM)",
        main = "5-FLUOROURACIL 24hr 75-1 no BG Empty Veh"
)
| Version | Author | Date |
|---|---|---|
| 109e14b | emmapfort | 2025-03-03 |
#FLUO 17-3 no BG Empty 24HR
par(mar = c(3.0, 3.0, 1.2, 1), mgp = c(2, .7, 0))
layout(matrix(c(1, 2, 1, 3), nrow = 2, ncol = 2), heights = c(0.5, 2, 2, 2))
#layout.show(3)
plot.new()
text(0.5,0.5,"FLUO no BG Empty Veh - 17-3 24hr",cex = 2,font = 2)

boxplot(fluo24hr17$Ind3_17_In_noBG_Low_Veh ~ fluo24hr17$Conc,
        ylim = c(0, 1.5),
        ylab = "Cell Viability (%)",
        xlab = "Concentration (uM)",
        main = "5-FLUOROURACIL 0hr 17-3 no BG Empty Veh"
)

boxplot(fluo24hr17$Ind3_17_Fin_noBG_Low_Veh ~ fluo24hr17$Conc,
        ylim = c(0, 1.5),
        ylab = "Cell Viability (%)",
        xlab = "Concentration (uM)",
        main = "5-FLUOROURACIL 24hr 17-3 no BG Empty Veh"
)
| Version | Author | Date |
|---|---|---|
| 109e14b | emmapfort | 2025-03-03 |
#####DMSO samples#####
#DMSO 78-1 24HR
par(mar = c(3.0, 3.0, 1.2, 1), mgp = c(2, .7, 0))
layout(matrix(c(1, 2, 1, 3), nrow = 2, ncol = 2), heights = c(0.5, 2, 2, 2))
#layout.show(3)
plot.new()
text(0.5,0.5,"DMSO no BG Empty Veh - 78-1 24hr",cex = 2,font = 2)

boxplot(dmso24hr78$Ind2_78_In_noBG_Low_Veh ~ dmso24hr78$Conc,
        ylim = c(0, 1.5),
        ylab = "Cell Viability (%)",
        xlab = "Concentration (uM)",
        main = "DMSO VEHICLE 0hr 78-1 no BG Empty Veh"
)

boxplot(dmso24hr78$Ind2_78_Fin_noBG_Low_Veh ~ dmso24hr78$Conc,
        ylim = c(0, 1.5),
        ylab = "Cell Viability (%)",
        xlab = "Concentration (uM)",
        main = "DMSO VEHICLE 24hr 78-1 no BG Empty Veh"
)
| Version | Author | Date |
|---|---|---|
| 109e14b | emmapfort | 2025-03-03 |
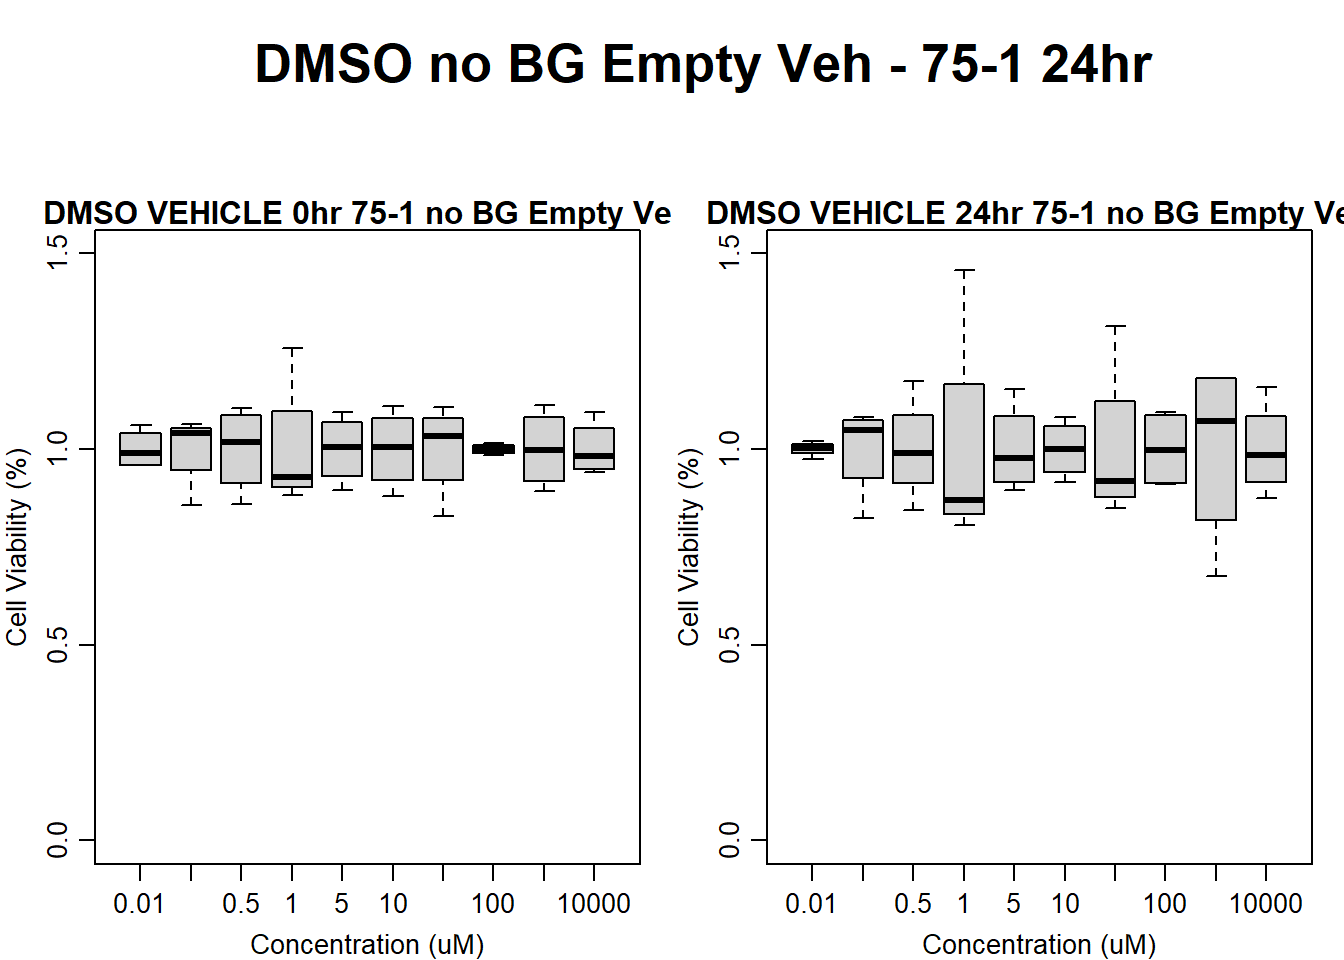
#DMSO 75-1 no BG Empty 24HR
par(mar = c(3.0, 3.0, 1.2, 1), mgp = c(2, .7, 0))
layout(matrix(c(1, 2, 1, 3), nrow = 2, ncol = 2), heights = c(0.5, 2, 2, 2))
#layout.show(3)
plot.new()
text(0.5,0.5,"DMSO no BG Empty Veh - 75-1 24hr",cex = 2,font = 2)

boxplot(dmso24hr75$Ind1_75_In_noBG_Low_Veh ~ dmso24hr75$Conc,
        ylim = c(0, 1.5),
        ylab = "Cell Viability (%)",
        xlab = "Concentration (uM)",
        main = "DMSO VEHICLE 0hr 75-1 no BG Empty Veh"
)

boxplot(dmso24hr75$Ind1_75_Fin_noBG_Low_Veh ~ dmso24hr75$Conc,
        ylim = c(0, 1.5),
        ylab = "Cell Viability (%)",
        xlab = "Concentration (uM)",
        main = "DMSO VEHICLE 24hr 75-1 no BG Empty Veh"
)
| Version | Author | Date |
|---|---|---|
| 109e14b | emmapfort | 2025-03-03 |
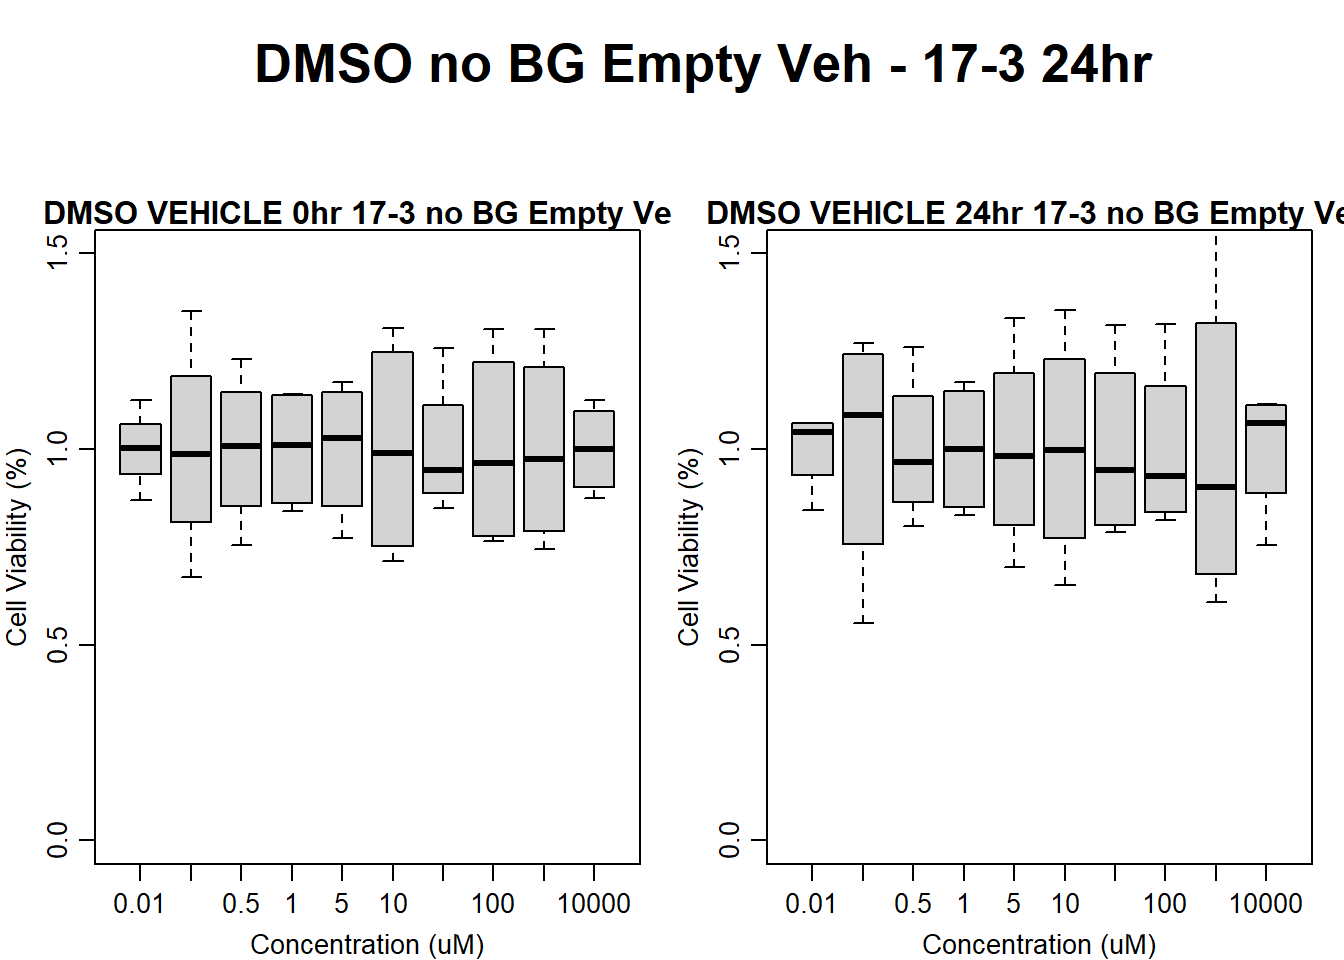
#DMSO 17-3 no BG Empty 24HR
par(mar = c(3.0, 3.0, 1.2, 1), mgp = c(2, .7, 0))
layout(matrix(c(1, 2, 1, 3), nrow = 2, ncol = 2), heights = c(0.5, 2, 2, 2))
#layout.show(3)
plot.new()
text(0.5,0.5,"DMSO no BG Empty Veh - 17-3 24hr",cex = 2,font = 2)

boxplot(dmso24hr17$Ind3_17_In_noBG_Low_Veh ~ dmso24hr17$Conc,
        ylim = c(0, 1.5),
        ylab = "Cell Viability (%)",
        xlab = "Concentration (uM)",
        main = "DMSO VEHICLE 0hr 17-3 no BG Empty Veh"
)

boxplot(dmso24hr17$Ind3_17_Fin_noBG_Low_Veh ~ dmso24hr17$Conc,
        ylim = c(0, 1.5),
        ylab = "Cell Viability (%)",
        xlab = "Concentration (uM)",
        main = "DMSO VEHICLE 24hr 17-3 no BG Empty Veh"
)
| Version | Author | Date |
|---|---|---|
| 109e14b | emmapfort | 2025-03-03 |
#####DOX Samples#####
#dox 78-1 Veh 48HR
par(mar = c(3.0, 3.0, 1.2, 1), mgp = c(2, .7, 0))
layout(matrix(c(1, 2, 1, 3), nrow = 2, ncol = 2), heights = c(0.5, 2, 2, 2))
#layout.show(3)
plot.new()
text(0.5,0.5,"DOX no BG Empty Veh - 78-1 48hr",cex = 2,font = 2)

boxplot(dox48hr78$Ind2_78_In_noBG_Low_Veh ~ dox48hr78$Conc,
        ylim = c(0, 1.5),
        ylab = "Cell Viability (%)",
        xlab = "Concentration (uM)",
        main = "DOXORUBICIN 0hr 78-1 no BG Empty Veh"
)

boxplot(dox48hr78$Ind2_78_Fin_noBG_Low_Veh ~ dox48hr78$Conc,
        ylim = c(0, 1.5),
        ylab = "Cell Viability (%)",
        xlab = "Concentration (uM)",
        main = "DOXORUBICIN 48hr 78-1 no BG Veh"
)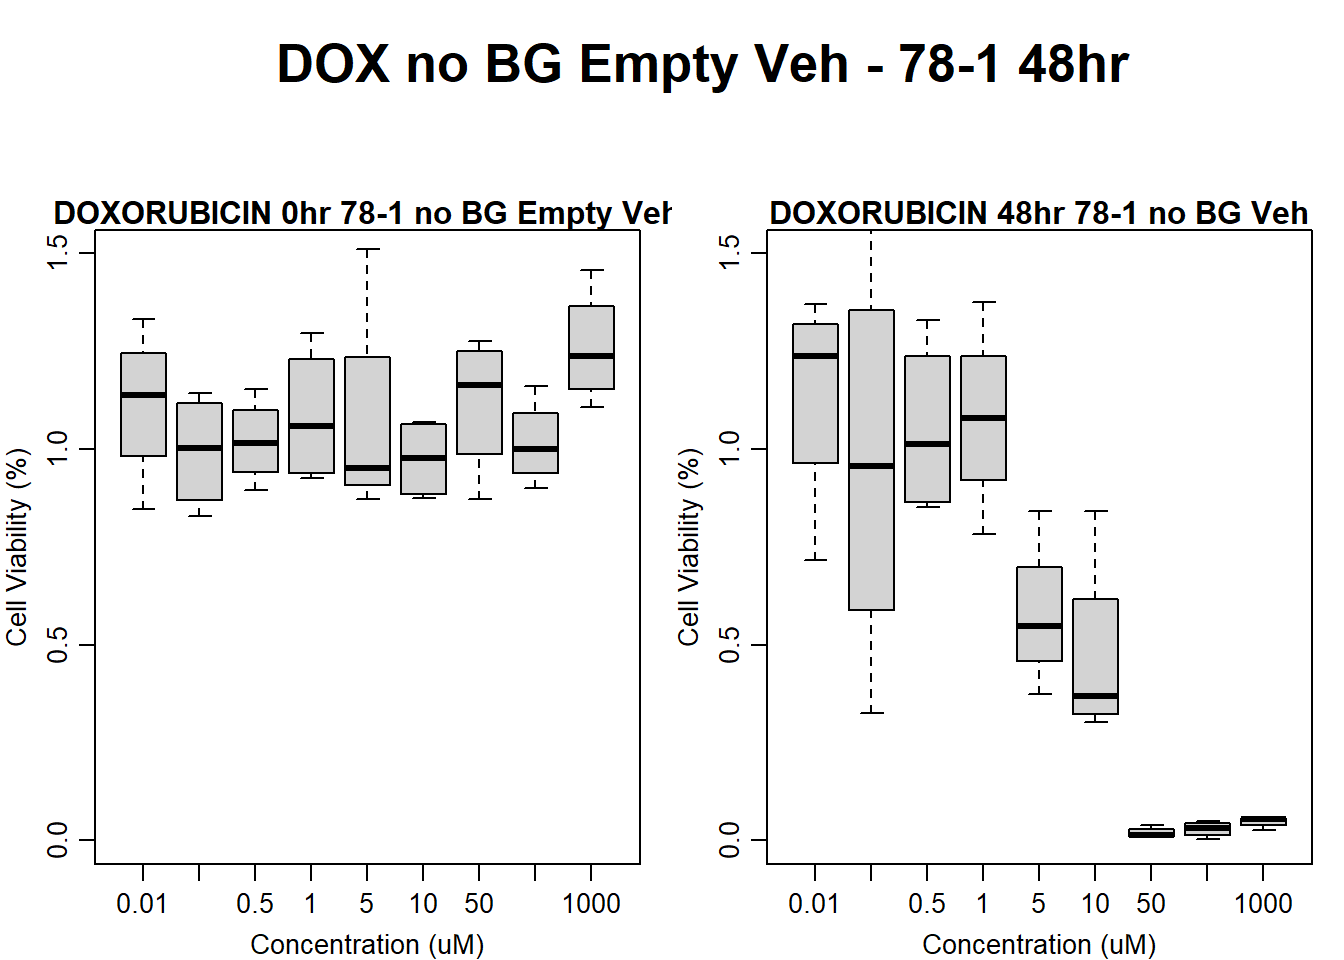
| Version | Author | Date |
|---|---|---|
| 109e14b | emmapfort | 2025-03-03 |
#dox 75-1 48HR
par(mar = c(3.0, 3.0, 1.2, 1), mgp = c(2, .7, 0))
layout(matrix(c(1, 2, 1, 3), nrow = 2, ncol = 2), heights = c(0.5, 2, 2, 2))
#layout.show(3)
plot.new()
text(0.5,0.5,"DOX no BG Empty Veh - 75-1 48hr",cex = 2,font = 2)

boxplot(dox48hr75$Ind1_75_In_noBG_Low_Veh ~ dox48hr75$Conc,
        ylim = c(0, 1.5),
        ylab = "Cell Viability (%)",
        xlab = "Concentration (uM)",
        main = "DOXORUBICIN 0hr 75-1 no BG Empty Veh"
)

boxplot(dox48hr75$Ind1_75_Fin_noBG_Low_Veh ~ dox48hr75$Conc,
        ylim = c(0, 1.5),
        ylab = "Cell Viability (%)",
        xlab = "Concentration (uM)",
        main = "DOXORUBICIN 48hr 75-1 no BG Empty Veh"
)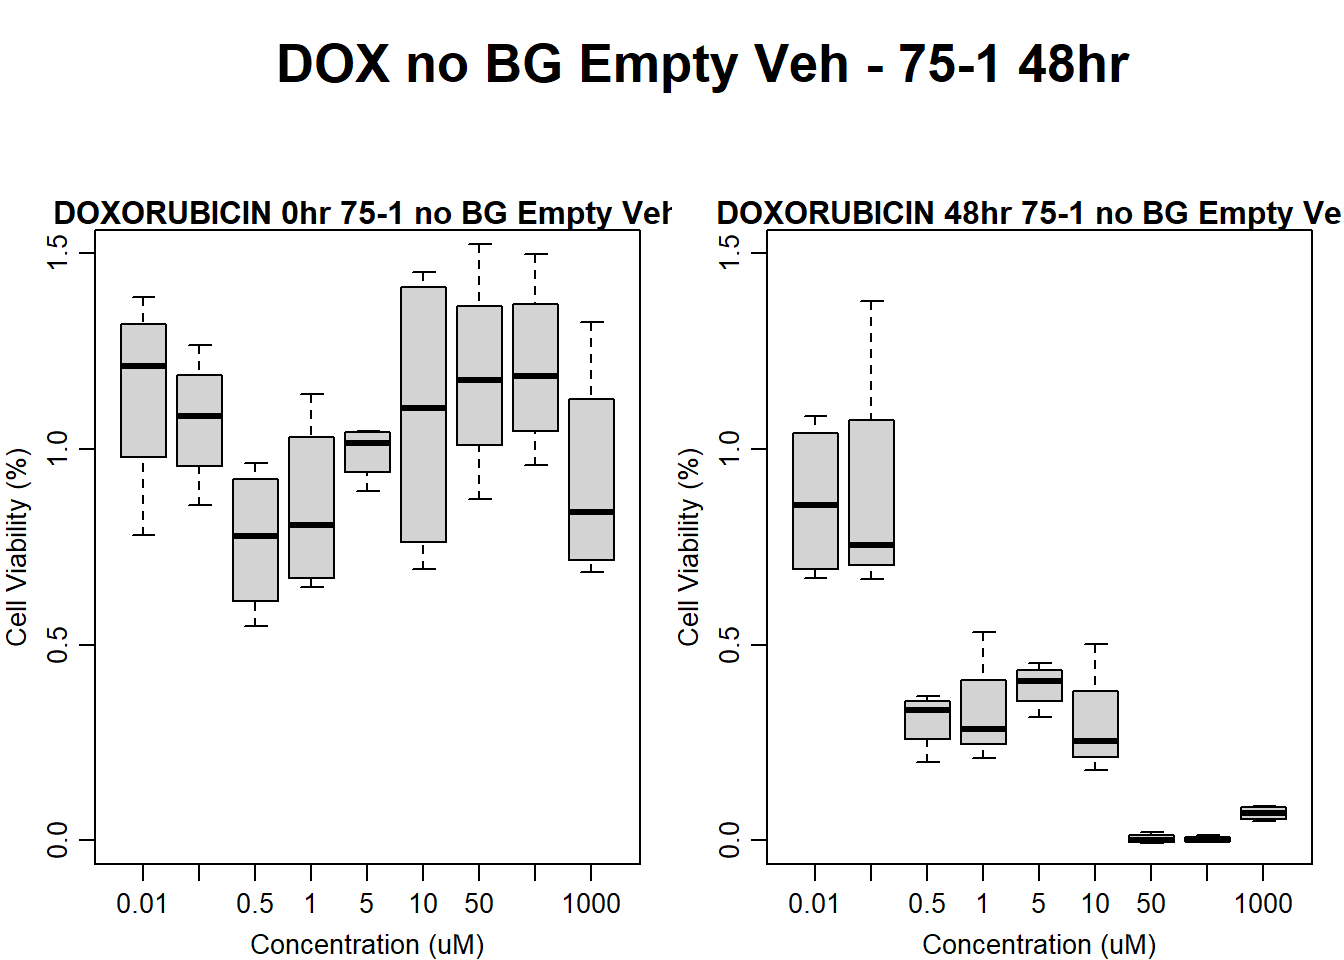
| Version | Author | Date |
|---|---|---|
| 109e14b | emmapfort | 2025-03-03 |
#dox 17-3 48HR
par(mar = c(3.0, 3.0, 1.2, 1), mgp = c(2, .7, 0))
layout(matrix(c(1, 2, 1, 3), nrow = 2, ncol = 2), heights = c(0.5, 2, 2, 2))
#layout.show(3)
plot.new()
text(0.5,0.5,"DOX no BG Empty Veh - 17-3 48hr",cex = 2,font = 2)

boxplot(dox48hr17$Ind3_17_In_noBG_Low_Veh ~ dox48hr17$Conc,
        ylim = c(0, 1.5),
        ylab = "Cell Viability (%)",
        xlab = "Concentration (uM)",
        main = "DOXORUBICIN 0hr 17-3 no BG Empty Veh"
)

boxplot(dox48hr17$Ind3_17_Fin_noBG_Low_Veh ~ dox48hr17$Conc,
        ylim = c(0, 1.5),
        ylab = "Cell Viability (%)",
        xlab = "Concentration (uM)",
        main = "DOXORUBICIN 48hr 17-3 no BG Empty Veh"
)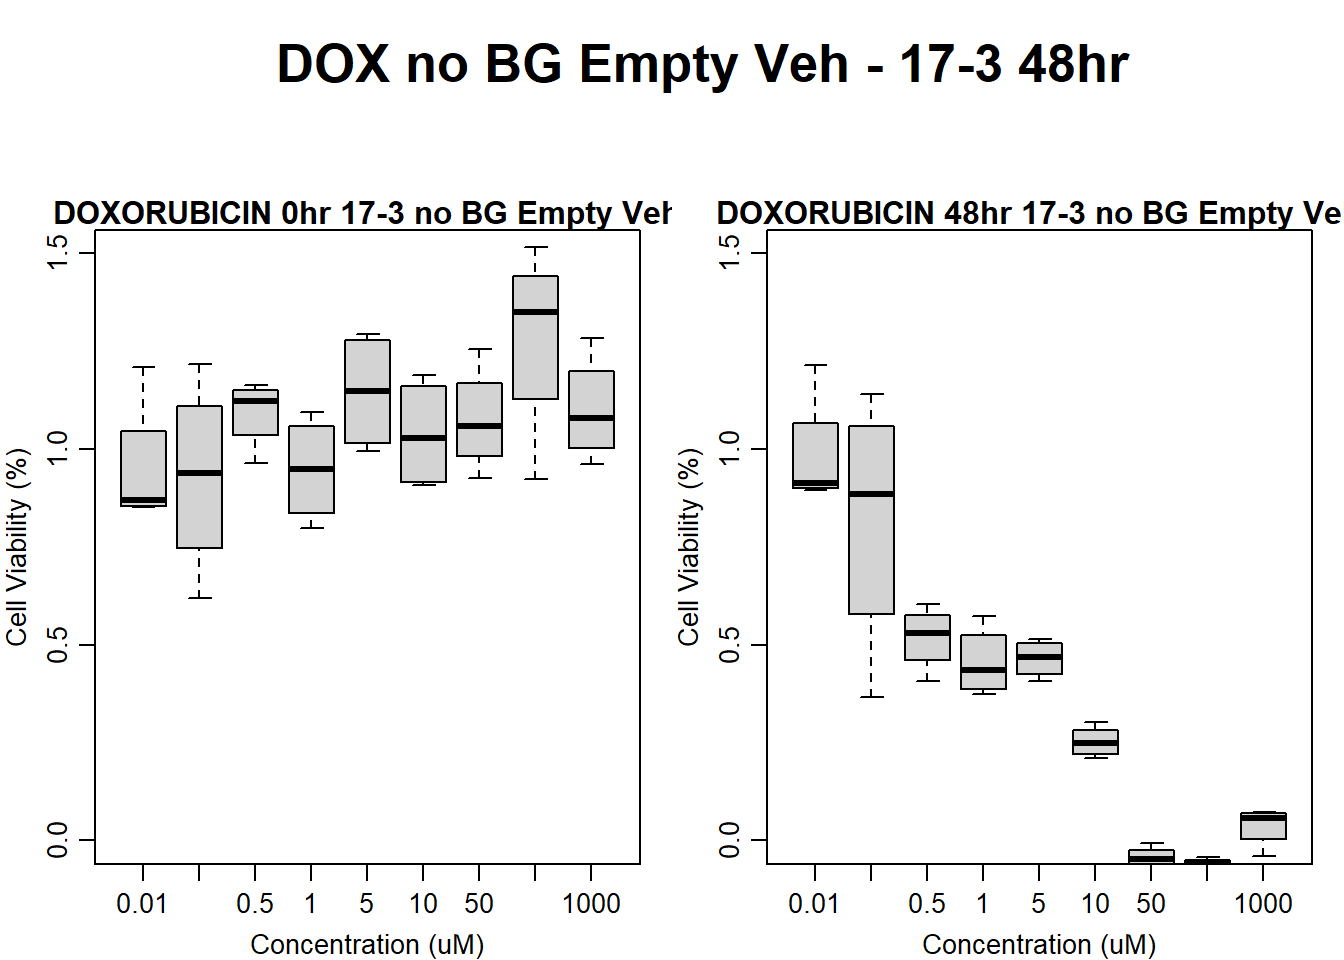
| Version | Author | Date |
|---|---|---|
| 109e14b | emmapfort | 2025-03-03 |
#####FLUO samples#####
#FLUO 78-1 no BG 48HR
par(mar = c(3.0, 3.0, 1.2, 1), mgp = c(2, .7, 0))
layout(matrix(c(1, 2, 1, 3), nrow = 2, ncol = 2), heights = c(0.5, 2, 2, 2))
#layout.show(3)
plot.new()
text(0.5,0.5,"FLUO no BG Empty Veh - 78-1 48hr",cex = 2,font = 2)

boxplot(fluo48hr78$Ind2_78_In_noBG_Low_Veh ~ fluo48hr78$Conc,
        ylim = c(0, 1.5),
        ylab = "Cell Viability (%)",
        xlab = "Concentration (uM)",
        main = "5-FLUOROURACIL 0hr 78-1 no BG Empty Veh"
)

boxplot(fluo48hr78$Ind2_78_Fin_noBG_Low_Veh ~ fluo48hr78$Conc,
        ylim = c(0, 1.5),
        ylab = "Cell Viability (%)",
        xlab = "Concentration (uM)",
        main = "5-FLUOROURACIL 48hr 78-1 no BG Empty Veh"
)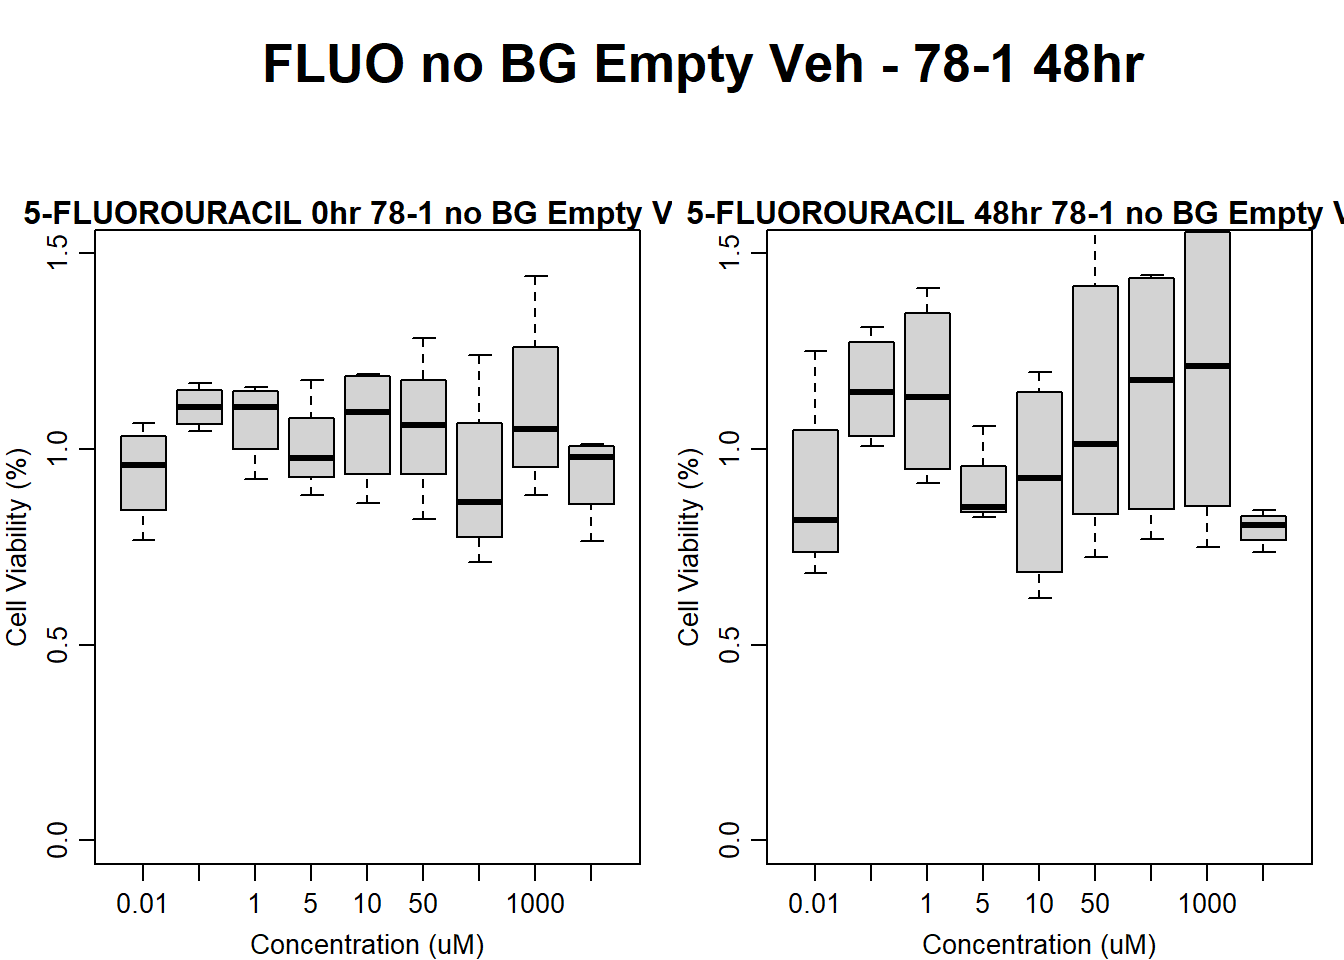
| Version | Author | Date |
|---|---|---|
| 109e14b | emmapfort | 2025-03-03 |
#FLUO 75-1 no BG Empty 48HR
par(mar = c(3.0, 3.0, 1.2, 1), mgp = c(2, .7, 0))
layout(matrix(c(1, 2, 1, 3), nrow = 2, ncol = 2), heights = c(0.5, 2, 2, 2))
#layout.show(3)
plot.new()
text(0.5,0.5,"FLUO no BG Empty Veh - 75-1 48hr",cex = 2,font = 2)

boxplot(fluo48hr75$Ind1_75_In_noBG_Low_Veh ~ fluo48hr75$Conc,
        ylim = c(0, 1.5),
        ylab = "Cell Viability (%)",
        xlab = "Concentration (uM)",
        main = "5-FLUOROURACIL 0hr 75-1 no BG Empty Veh"
)

boxplot(fluo48hr75$Ind1_75_Fin_noBG_Low_Veh ~ fluo48hr75$Conc,
        ylim = c(0, 1.5),
        ylab = "Cell Viability (%)",
        xlab = "Concentration (uM)",
        main = "5-FLUOROURACIL 48hr 75-1 no BG Empty Veh"
)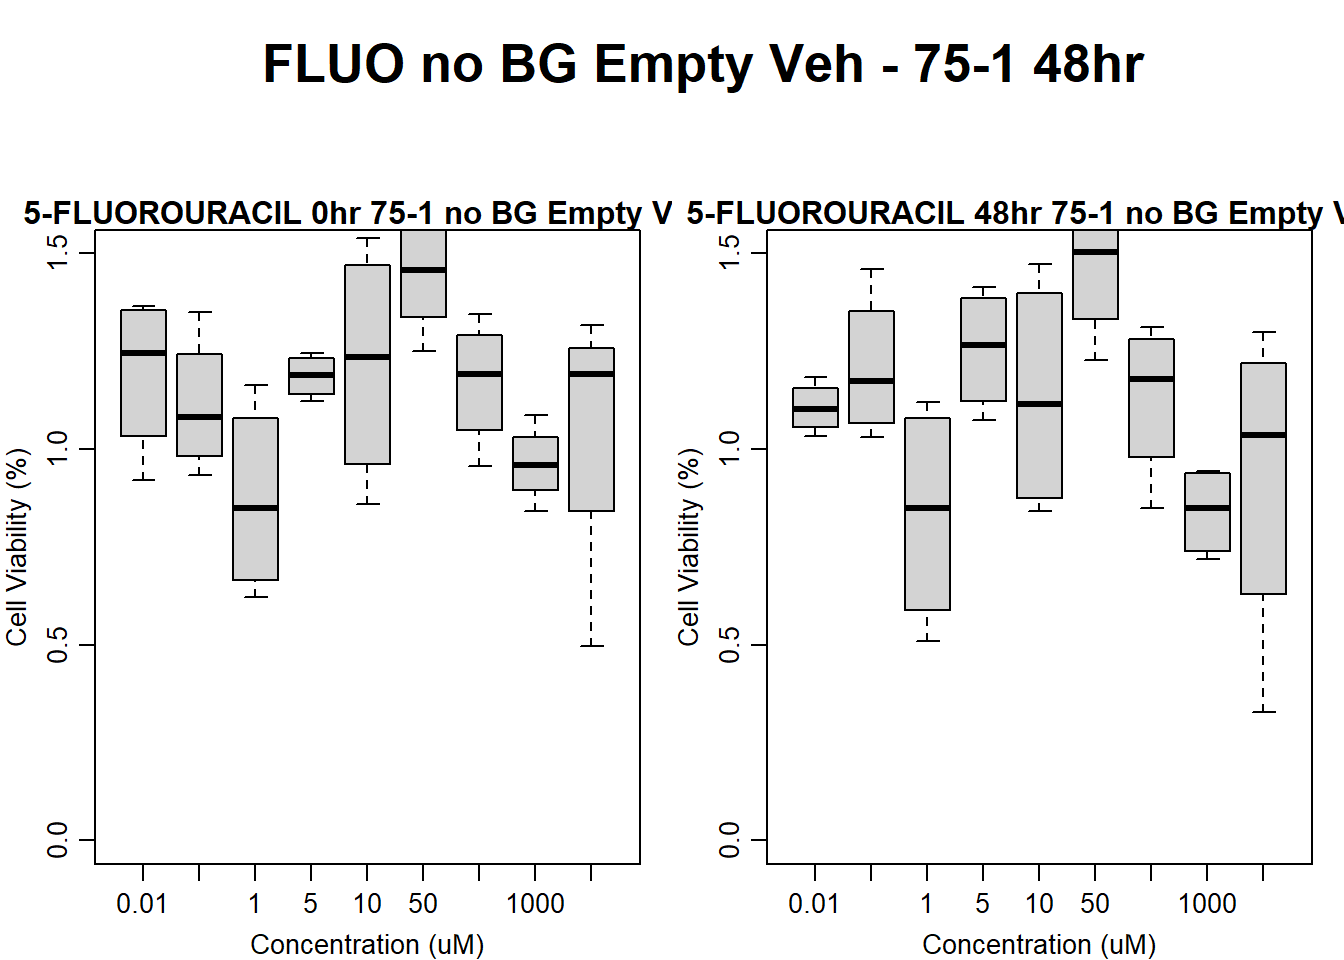
| Version | Author | Date |
|---|---|---|
| 109e14b | emmapfort | 2025-03-03 |
#FLUO 17-3 no BG Empty 48HR
par(mar = c(3.0, 3.0, 1.2, 1), mgp = c(2, .7, 0))
layout(matrix(c(1, 2, 1, 3), nrow = 2, ncol = 2), heights = c(0.5, 2, 2, 2))
#layout.show(3)
plot.new()
text(0.5,0.5,"FLUO no BG Empty Veh - 17-3 48hr",cex = 2,font = 2)

boxplot(fluo48hr17$Ind3_17_In_noBG_Low_Veh ~ fluo48hr17$Conc,
        ylim = c(0, 1.5),
        ylab = "Cell Viability (%)",
        xlab = "Concentration (uM)",
        main = "5-FLUOROURACIL 0hr 17-3 no BG Empty Veh"
)

boxplot(fluo48hr17$Ind3_17_Fin_noBG_Low_Veh ~ fluo48hr17$Conc,
        ylim = c(0, 1.5),
        ylab = "Cell Viability (%)",
        xlab = "Concentration (uM)",
        main = "5-FLUOROURACIL 48hr 17-3 no BG Empty Veh"
)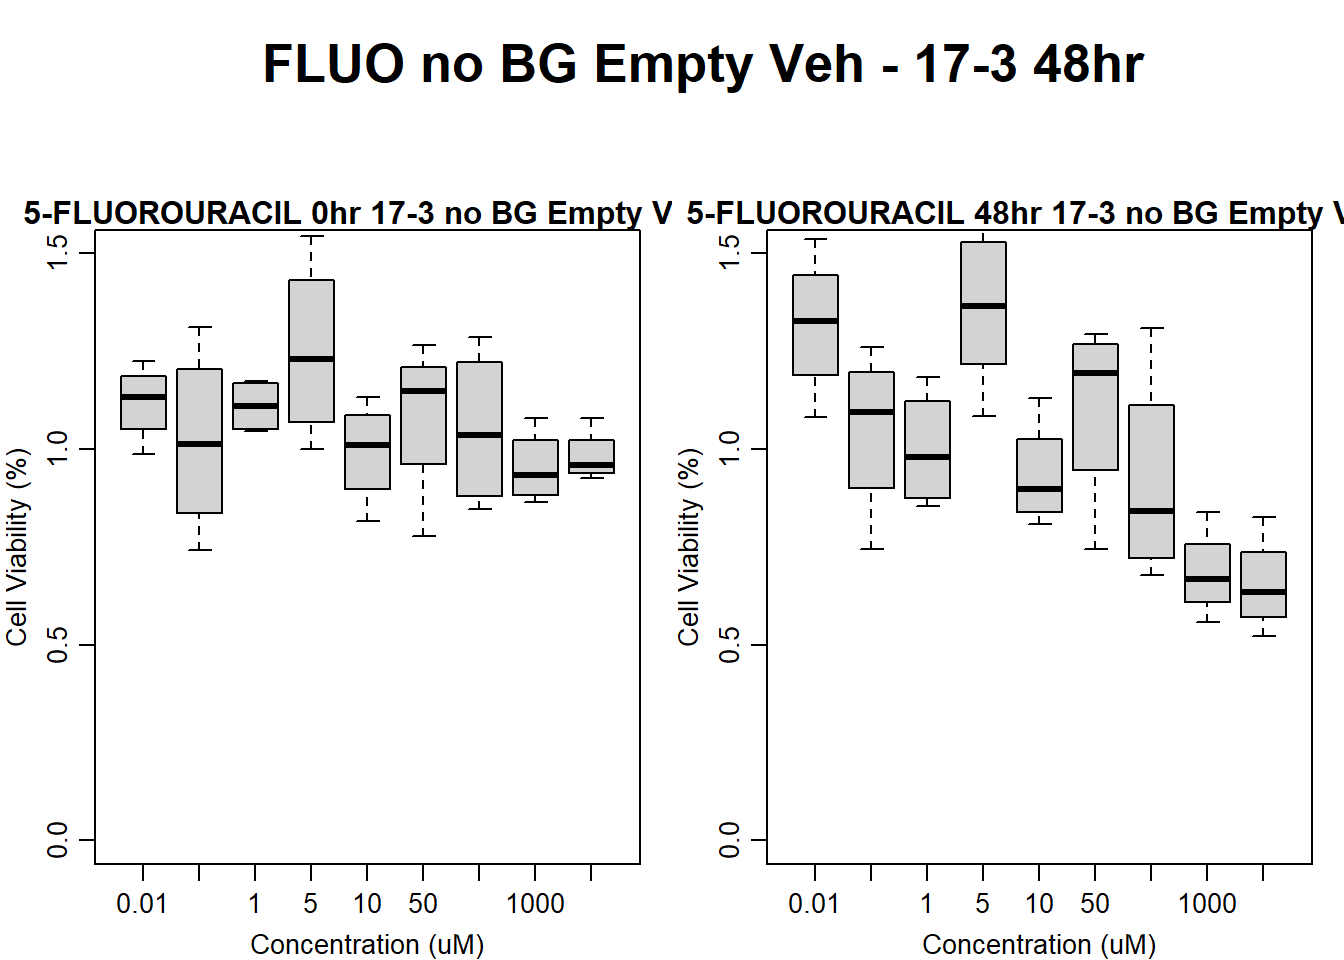
| Version | Author | Date |
|---|---|---|
| 109e14b | emmapfort | 2025-03-03 |
#####DMSO samples#####
#DMSO 78-1 48HR
par(mar = c(3.0, 3.0, 1.2, 1), mgp = c(2, .7, 0))
layout(matrix(c(1, 2, 1, 3), nrow = 2, ncol = 2), heights = c(0.5, 2, 2, 2))
#layout.show(3)
plot.new()
text(0.5,0.5,"DMSO no BG Empty Veh - 78-1 48hr",cex = 2,font = 2)

boxplot(dmso48hr78$Ind2_78_In_noBG_Low_Veh ~ dmso48hr78$Conc,
        ylim = c(0, 1.5),
        ylab = "Cell Viability (%)",
        xlab = "Concentration (uM)",
        main = "DMSO VEHICLE 0hr 78-1 no BG Empty Veh"
)

boxplot(dmso48hr78$Ind2_78_Fin_noBG_Low_Veh ~ dmso48hr78$Conc,
        ylim = c(0, 1.5),
        ylab = "Cell Viability (%)",
        xlab = "Concentration (uM)",
        main = "DMSO VEHICLE 48hr 78-1 no BG Empty Veh"
)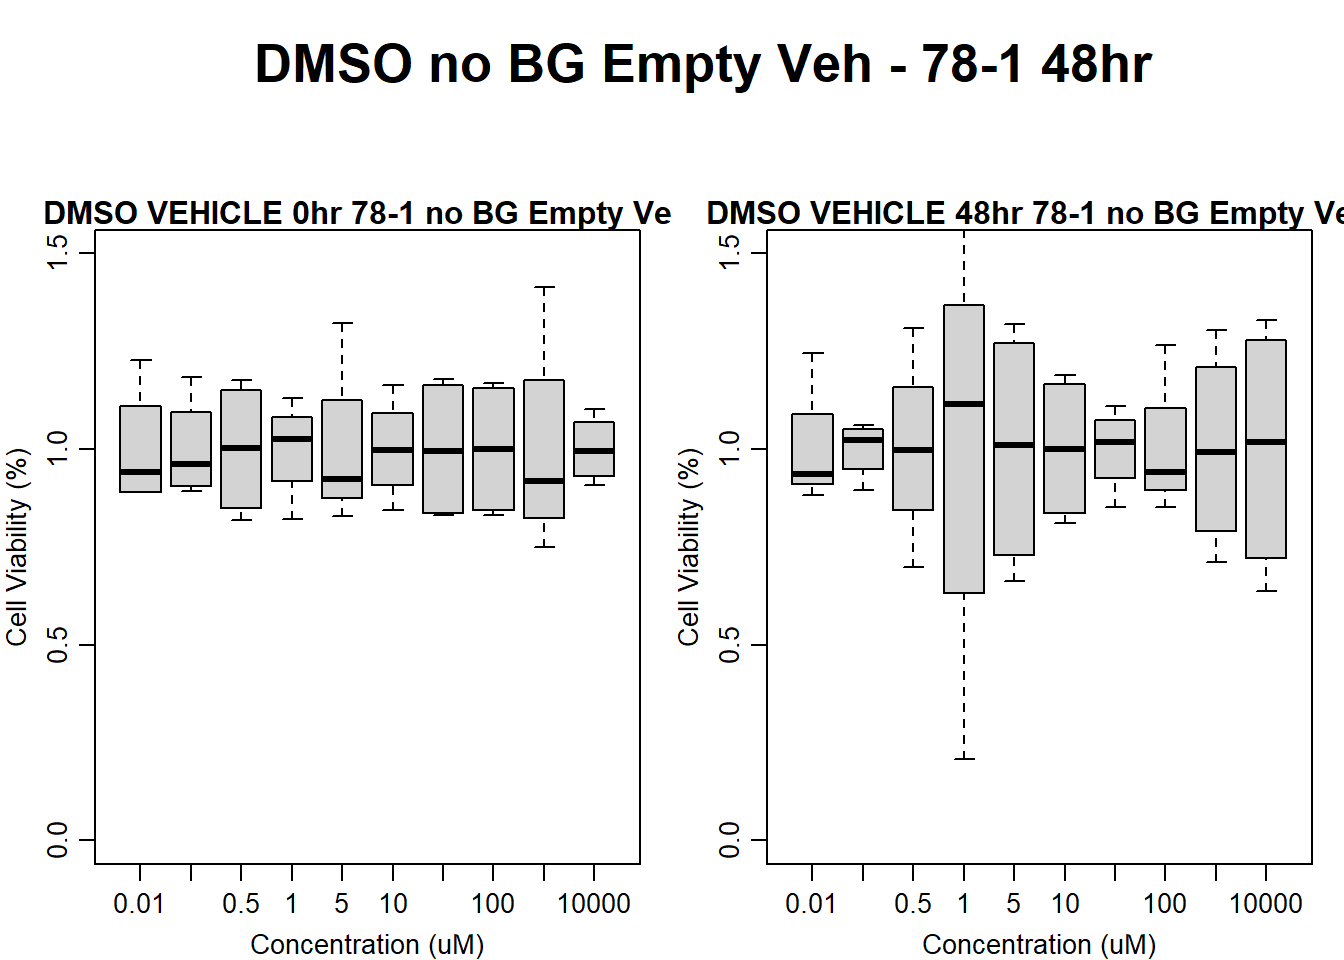
| Version | Author | Date |
|---|---|---|
| 109e14b | emmapfort | 2025-03-03 |
#DMSO 75-1 no BG Empty 48HR
par(mar = c(3.0, 3.0, 1.2, 1), mgp = c(2, .7, 0))
layout(matrix(c(1, 2, 1, 3), nrow = 2, ncol = 2), heights = c(0.5, 2, 2, 2))
#layout.show(3)
plot.new()
text(0.5,0.5,"DMSO no BG Empty Veh - 75-1 48hr",cex = 2,font = 2)

boxplot(dmso48hr75$Ind1_75_In_noBG_Low_Veh ~ dmso48hr75$Conc,
        ylim = c(0, 1.5),
        ylab = "Cell Viability (%)",
        xlab = "Concentration (uM)",
        main = "DMSO VEHICLE 0hr 75-1 no BG Empty Veh"
)

boxplot(dmso48hr75$Ind1_75_Fin_noBG_Low_Veh ~ dmso48hr75$Conc,
        ylim = c(0, 1.5),
        ylab = "Cell Viability (%)",
        xlab = "Concentration (uM)",
        main = "DMSO VEHICLE 48hr 75-1 no BG Empty Veh"
)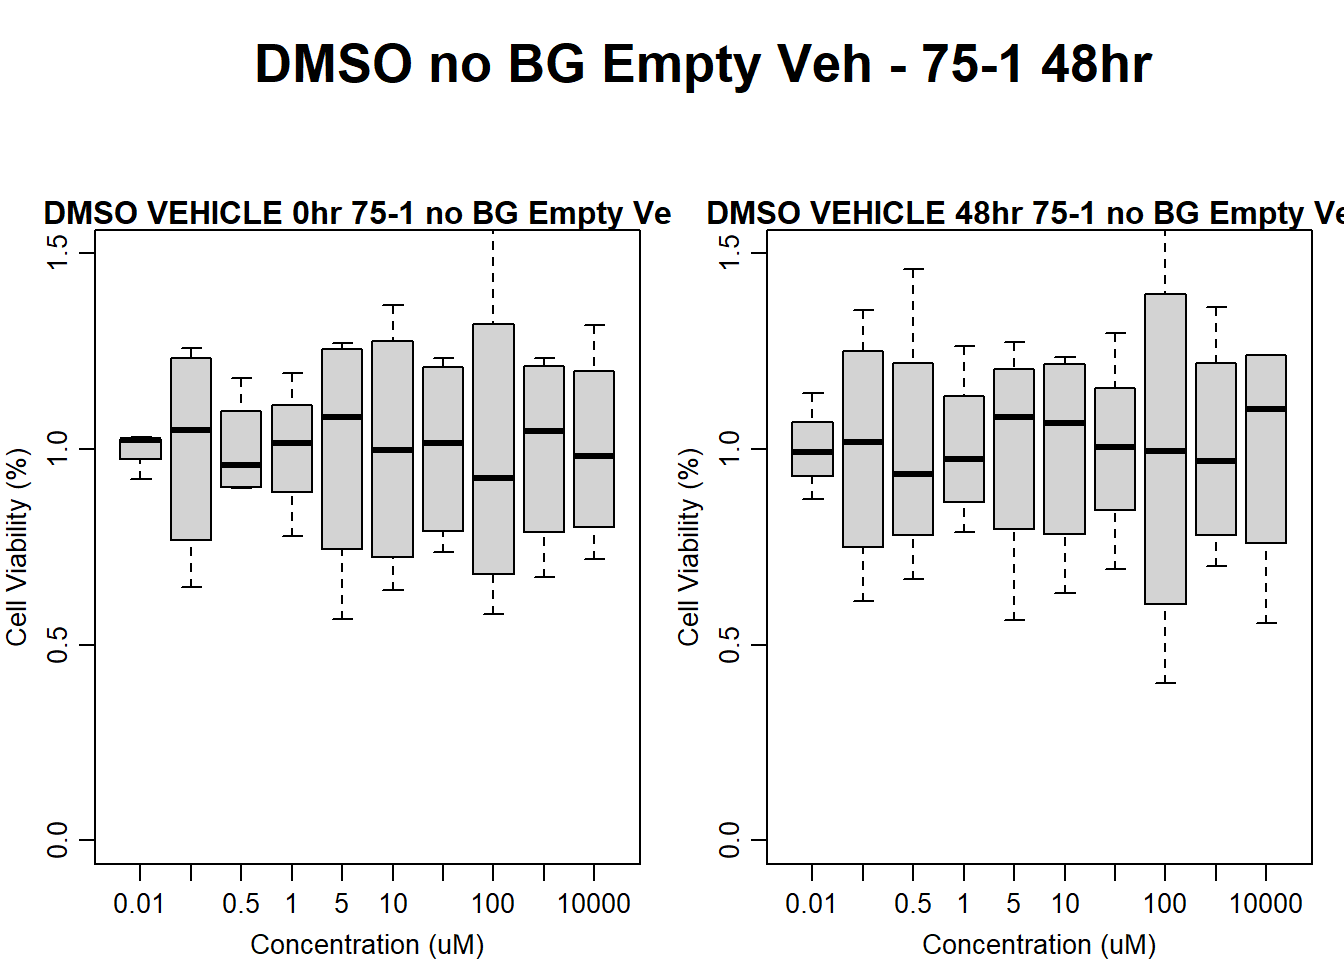
| Version | Author | Date |
|---|---|---|
| 109e14b | emmapfort | 2025-03-03 |
#DMSO 17-3 no BG Empty 48HR
par(mar = c(3.0, 3.0, 1.2, 1), mgp = c(2, .7, 0))
layout(matrix(c(1, 2, 1, 3), nrow = 2, ncol = 2), heights = c(0.5, 2, 2, 2))
#layout.show(3)
plot.new()
text(0.5,0.5,"DMSO no BG Empty Veh - 17-3 48hr",cex = 2,font = 2)

boxplot(dmso48hr17$Ind3_17_In_noBG_Low_Veh ~ dmso48hr17$Conc,
        ylim = c(0, 1.5),
        ylab = "Cell Viability (%)",
        xlab = "Concentration (uM)",
        main = "DMSO VEHICLE 0hr 17-3 no BG Empty Veh"
)

boxplot(dmso48hr17$Ind3_17_Fin_noBG_Low_Veh ~ dmso48hr17$Conc,
        ylim = c(0, 1.5),
        ylab = "Cell Viability (%)",
        xlab = "Concentration (uM)",
        main = "DMSO VEHICLE 48hr 17-3 no BG Empty Veh"
)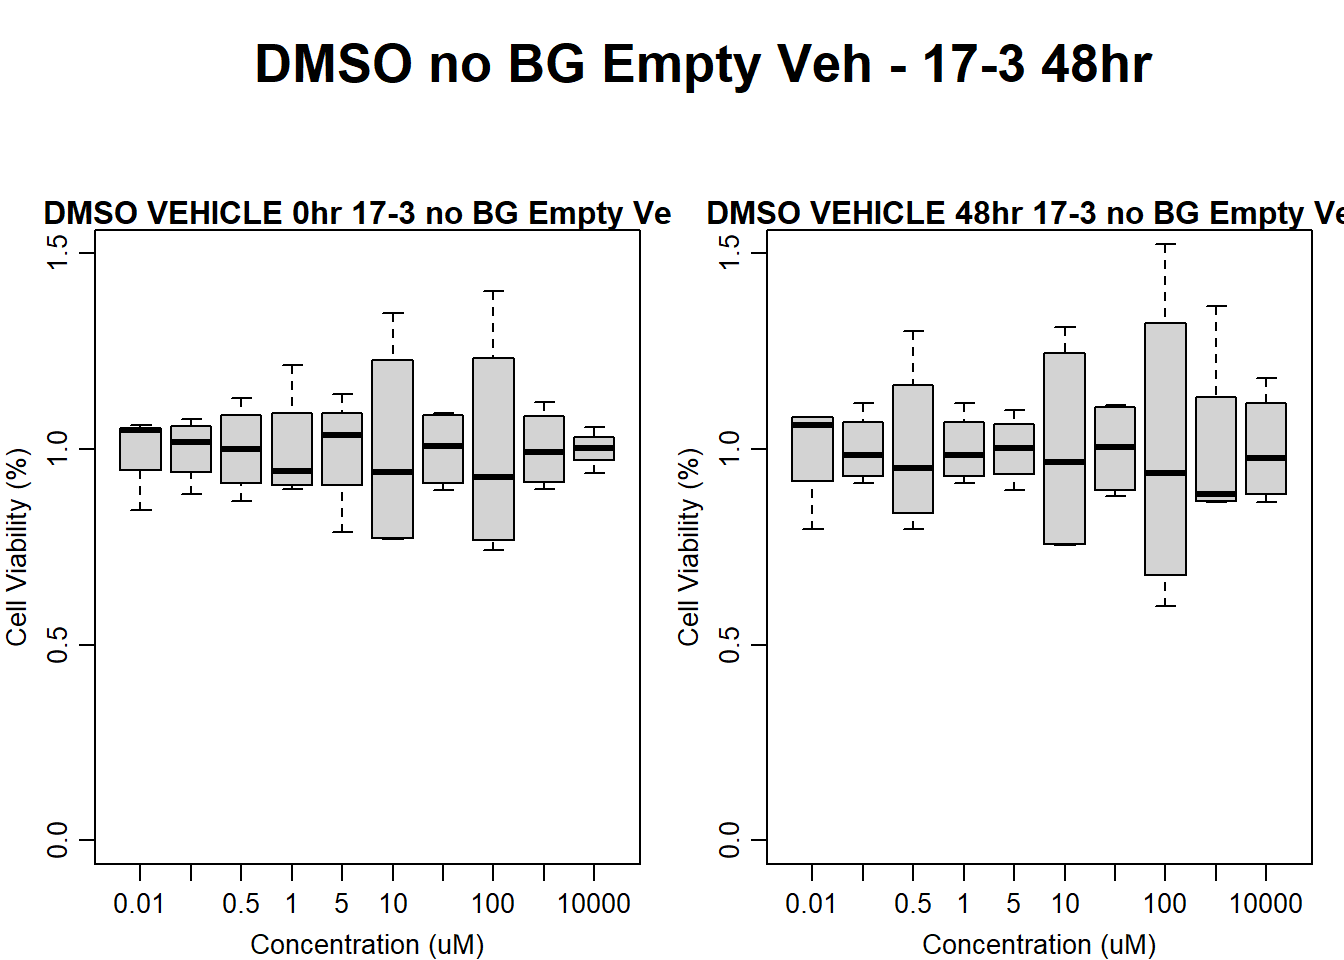
| Version | Author | Date |
|---|---|---|
| 109e14b | emmapfort | 2025-03-03 |
#####DOX Samples#####
#dox 78-1 Veh 72HR
par(mar = c(3.0, 3.0, 1.2, 1), mgp = c(2, .7, 0))
layout(matrix(c(1, 2, 1, 3), nrow = 2, ncol = 2), heights = c(0.5, 2, 2, 2))
#layout.show(3)
plot.new()
text(0.5,0.5,"DOX no BG Empty Veh - 78-1 72hr",cex = 2,font = 2)

boxplot(dox72hr78$Ind2_78_In_noBG_Low_Veh ~ dox72hr78$Conc,
        ylim = c(0, 1.5),
        ylab = "Cell Viability (%)",
        xlab = "Concentration (uM)",
        main = "DOXORUBICIN 0hr 78-1 no BG Empty Veh"
)

boxplot(dox72hr78$Ind2_78_Fin_noBG_Low_Veh ~ dox72hr78$Conc,
        ylim = c(0, 1.5),
        ylab = "Cell Viability (%)",
        xlab = "Concentration (uM)",
        main = "DOXORUBICIN 72hr 78-1 no BG Veh"
)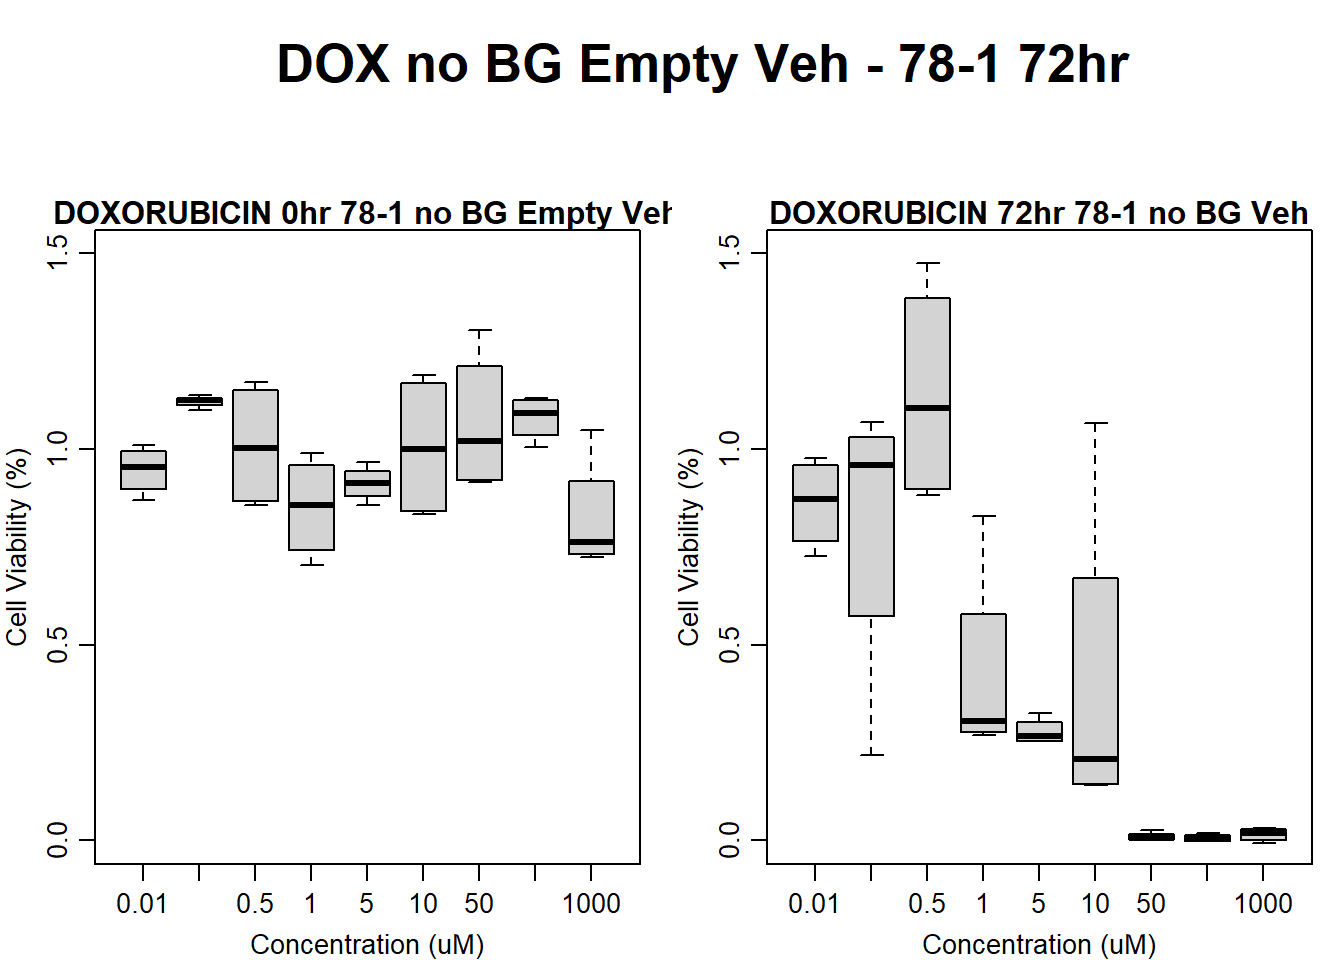
| Version | Author | Date |
|---|---|---|
| 109e14b | emmapfort | 2025-03-03 |
#dox 75-1 72HR
par(mar = c(3.0, 3.0, 1.2, 1), mgp = c(2, .7, 0))
layout(matrix(c(1, 2, 1, 3), nrow = 2, ncol = 2), heights = c(0.5, 2, 2, 2))
#layout.show(3)
plot.new()
text(0.5,0.5,"DOX no BG Empty Veh - 75-1 72hr",cex = 2,font = 2)

boxplot(dox72hr75$Ind1_75_In_noBG_Low_Veh ~ dox72hr75$Conc,
        ylim = c(0, 1.5),
        ylab = "Cell Viability (%)",
        xlab = "Concentration (uM)",
        main = "DOXORUBICIN 0hr 75-1 no BG Empty Veh"
)

boxplot(dox72hr75$Ind1_75_Fin_noBG_Low_Veh ~ dox72hr75$Conc,
        ylim = c(0, 1.5),
        ylab = "Cell Viability (%)",
        xlab = "Concentration (uM)",
        main = "DOXORUBICIN 72hr 75-1 no BG Empty Veh"
)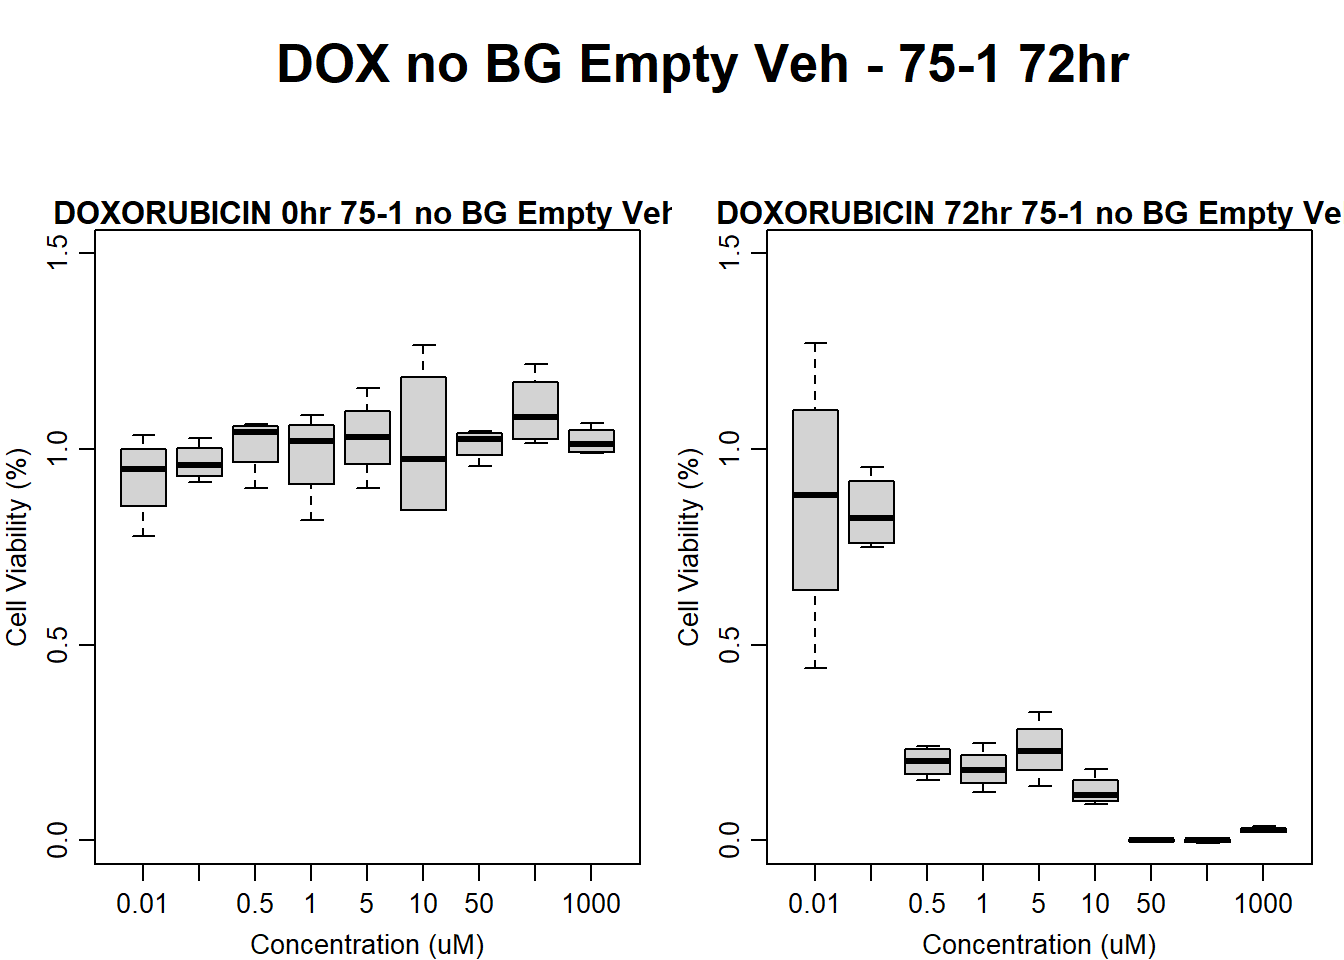
| Version | Author | Date |
|---|---|---|
| 109e14b | emmapfort | 2025-03-03 |
#dox 17-3 72HR
par(mar = c(3.0, 3.0, 1.2, 1), mgp = c(2, .7, 0))
layout(matrix(c(1, 2, 1, 3), nrow = 2, ncol = 2), heights = c(0.5, 2, 2, 2))
#layout.show(3)
plot.new()
text(0.5,0.5,"DOX no BG Empty Veh - 17-3 72hr",cex = 2,font = 2)

boxplot(dox72hr17$Ind3_17_In_noBG_Low_Veh ~ dox72hr17$Conc,
        ylim = c(0, 1.5),
        ylab = "Cell Viability (%)",
        xlab = "Concentration (uM)",
        main = "DOXORUBICIN 0hr 17-3 no BG Empty Veh"
)

boxplot(dox72hr17$Ind3_17_Fin_noBG_Low_Veh ~ dox72hr17$Conc,
        ylim = c(0, 1.5),
        ylab = "Cell Viability (%)",
        xlab = "Concentration (uM)",
        main = "DOXORUBICIN 72hr 17-3 no BG Empty Veh"
)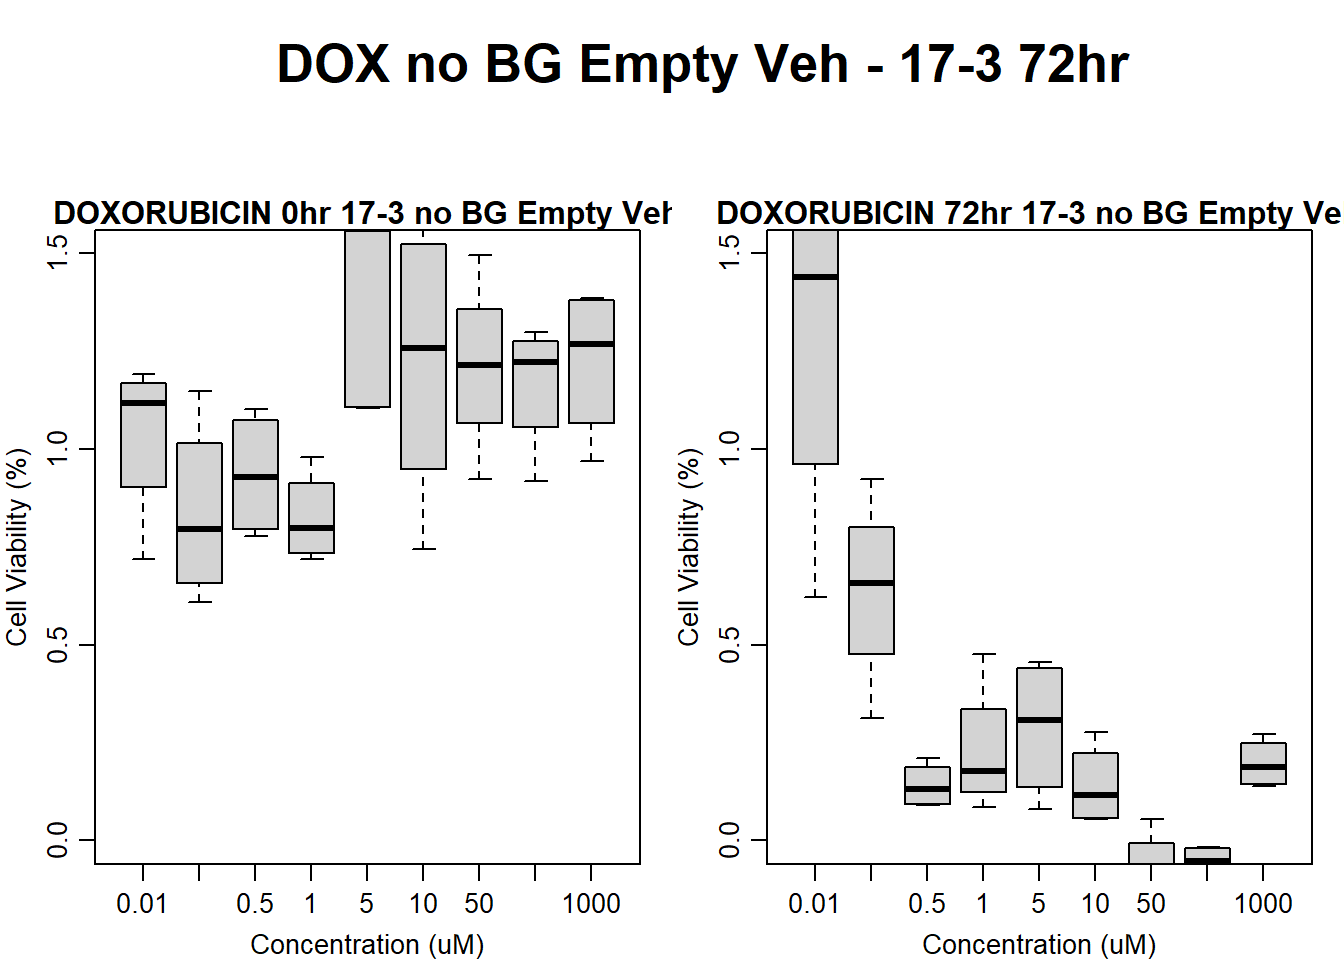
| Version | Author | Date |
|---|---|---|
| 109e14b | emmapfort | 2025-03-03 |
#####FLUO samples#####
#FLUO 78-1 no BG 72HR
par(mar = c(3.0, 3.0, 1.2, 1), mgp = c(2, .7, 0))
layout(matrix(c(1, 2, 1, 3), nrow = 2, ncol = 2), heights = c(0.5, 2, 2, 2))
#layout.show(3)
plot.new()
text(0.5,0.5,"FLUO no BG Empty Veh - 78-1 72hr",cex = 2,font = 2)

boxplot(fluo72hr78$Ind2_78_In_noBG_Low_Veh ~ fluo72hr78$Conc,
        ylim = c(0, 1.5),
        ylab = "Cell Viability (%)",
        xlab = "Concentration (uM)",
        main = "5-FLUOROURACIL 0hr 78-1 no BG Empty Veh"
)

boxplot(fluo72hr78$Ind2_78_Fin_noBG_Low_Veh ~ fluo72hr78$Conc,
        ylim = c(0, 1.5),
        ylab = "Cell Viability (%)",
        xlab = "Concentration (uM)",
        main = "5-FLUOROURACIL 72hr 78-1 no BG Empty Veh"
)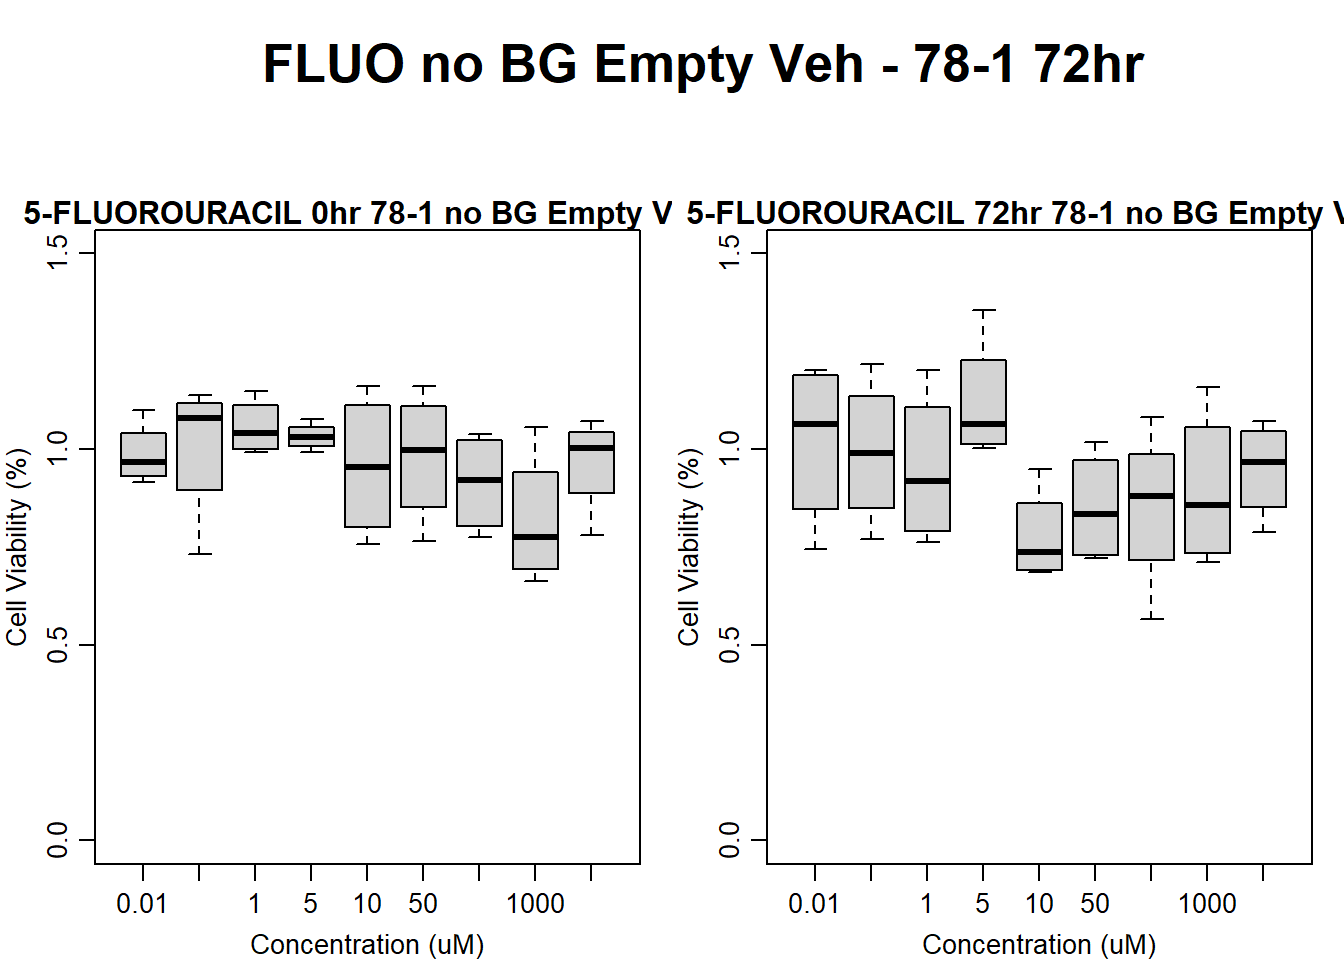
| Version | Author | Date |
|---|---|---|
| 109e14b | emmapfort | 2025-03-03 |
#FLUO 75-1 no BG Empty 72HR
par(mar = c(3.0, 3.0, 1.2, 1), mgp = c(2, .7, 0))
layout(matrix(c(1, 2, 1, 3), nrow = 2, ncol = 2), heights = c(0.5, 2, 2, 2))
#layout.show(3)
plot.new()
text(0.5,0.5,"FLUO no BG Empty Veh - 75-1 72hr",cex = 2,font = 2)

boxplot(fluo72hr75$Ind1_75_In_noBG_Low_Veh ~ fluo72hr75$Conc,
        ylim = c(0, 1.5),
        ylab = "Cell Viability (%)",
        xlab = "Concentration (uM)",
        main = "5-FLUOROURACIL 0hr 75-1 no BG Empty Veh"
)

boxplot(fluo72hr75$Ind1_75_Fin_noBG_Low_Veh ~ fluo72hr75$Conc,
        ylim = c(0, 1.5),
        ylab = "Cell Viability (%)",
        xlab = "Concentration (uM)",
        main = "5-FLUOROURACIL 72hr 75-1 no BG Empty Veh"
)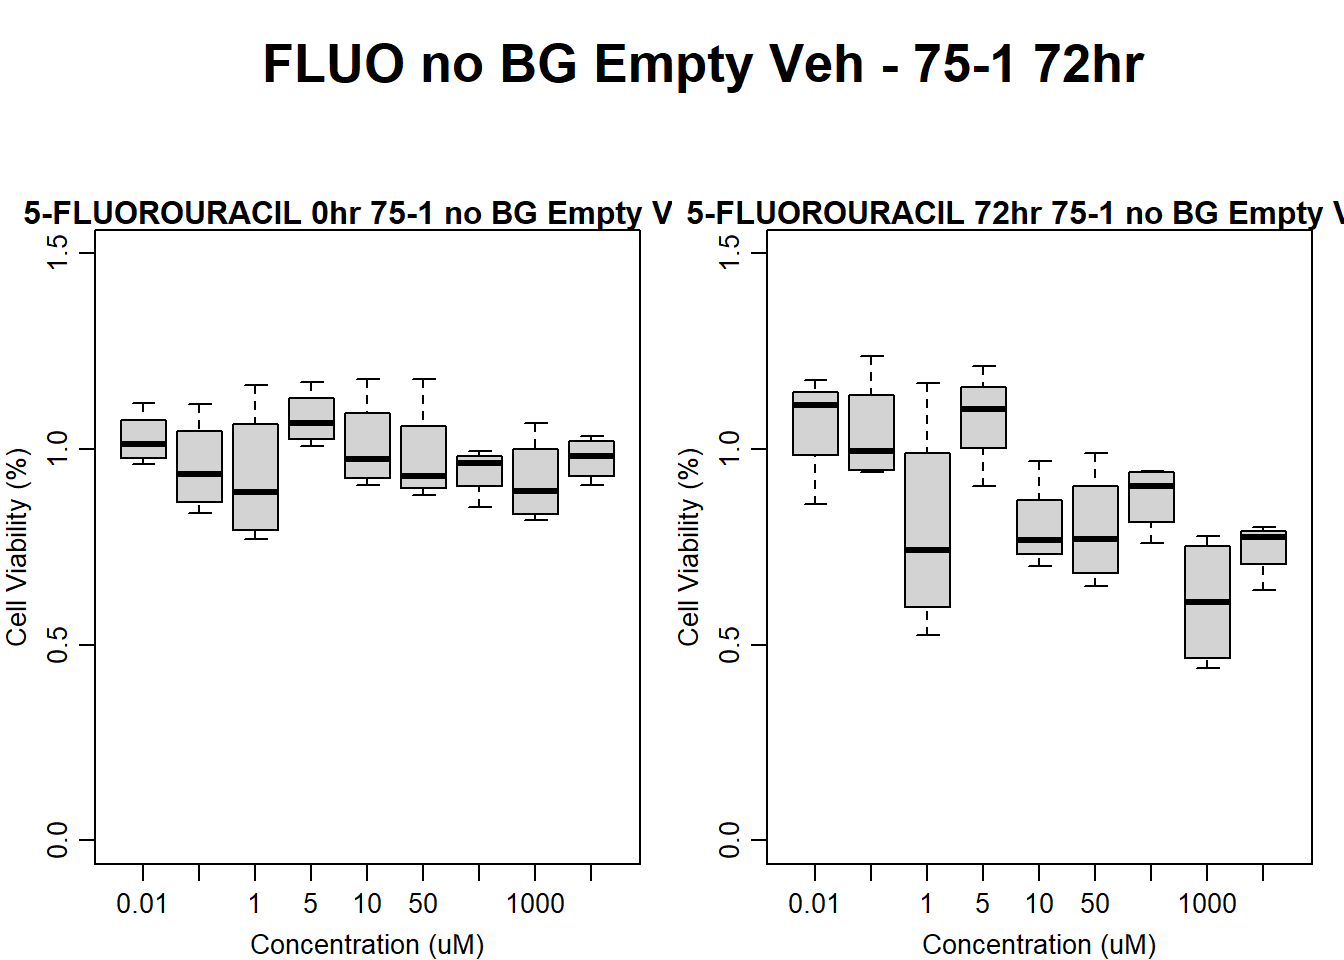
| Version | Author | Date |
|---|---|---|
| 109e14b | emmapfort | 2025-03-03 |
#FLUO 17-3 no BG Empty 72HR
par(mar = c(3.0, 3.0, 1.2, 1), mgp = c(2, .7, 0))
layout(matrix(c(1, 2, 1, 3), nrow = 2, ncol = 2), heights = c(0.5, 2, 2, 2))
#layout.show(3)
plot.new()
text(0.5,0.5,"FLUO no BG Empty Veh - 17-3 72hr",cex = 2,font = 2)

boxplot(fluo72hr17$Ind3_17_In_noBG_Low_Veh ~ fluo72hr17$Conc,
        ylim = c(0, 1.5),
        ylab = "Cell Viability (%)",
        xlab = "Concentration (uM)",
        main = "5-FLUOROURACIL 0hr 17-3 no BG Empty Veh"
)

boxplot(fluo72hr17$Ind3_17_Fin_noBG_Low_Veh ~ fluo72hr17$Conc,
        ylim = c(0, 1.5),
        ylab = "Cell Viability (%)",
        xlab = "Concentration (uM)",
        main = "5-FLUOROURACIL 72hr 17-3 no BG Empty Veh"
)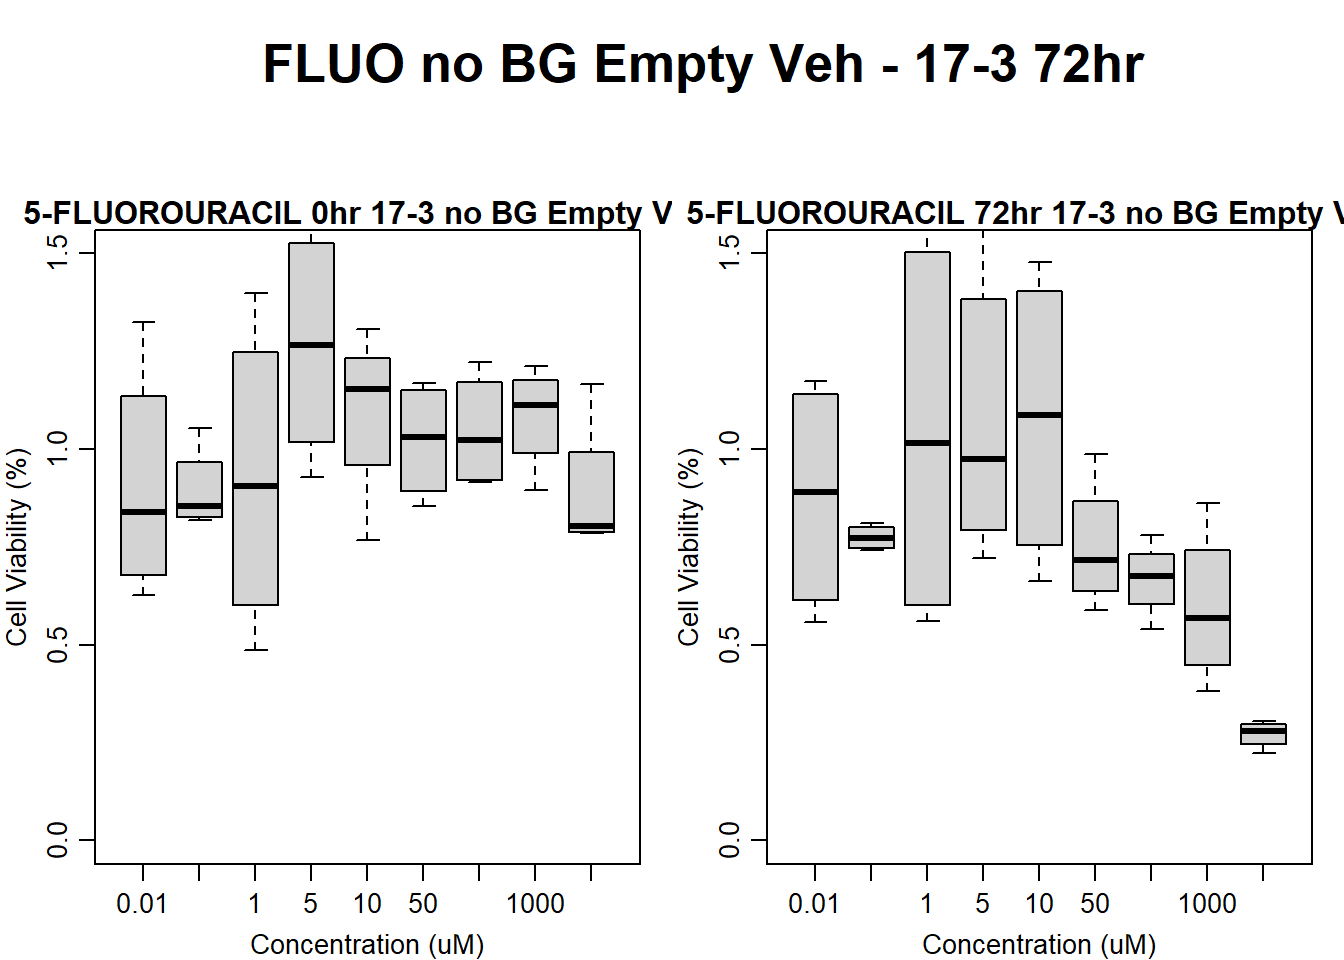
| Version | Author | Date |
|---|---|---|
| 109e14b | emmapfort | 2025-03-03 |
#####DMSO samples#####
#DMSO 78-1 72HR
par(mar = c(3.0, 3.0, 1.2, 1), mgp = c(2, .7, 0))
layout(matrix(c(1, 2, 1, 3), nrow = 2, ncol = 2), heights = c(0.5, 2, 2, 2))
#layout.show(3)
plot.new()
text(0.5,0.5,"DMSO no BG Empty Veh - 78-1 72hr",cex = 2,font = 2)

boxplot(dmso72hr78$Ind2_78_In_noBG_Low_Veh ~ dmso72hr78$Conc,
        ylim = c(0, 1.5),
        ylab = "Cell Viability (%)",
        xlab = "Concentration (uM)",
        main = "DMSO VEHICLE 0hr 78-1 no BG Empty Veh"
)

boxplot(dmso72hr78$Ind2_78_Fin_noBG_Low_Veh ~ dmso72hr78$Conc,
        ylim = c(0, 1.5),
        ylab = "Cell Viability (%)",
        xlab = "Concentration (uM)",
        main = "DMSO VEHICLE 72hr 78-1 no BG Empty Veh"
)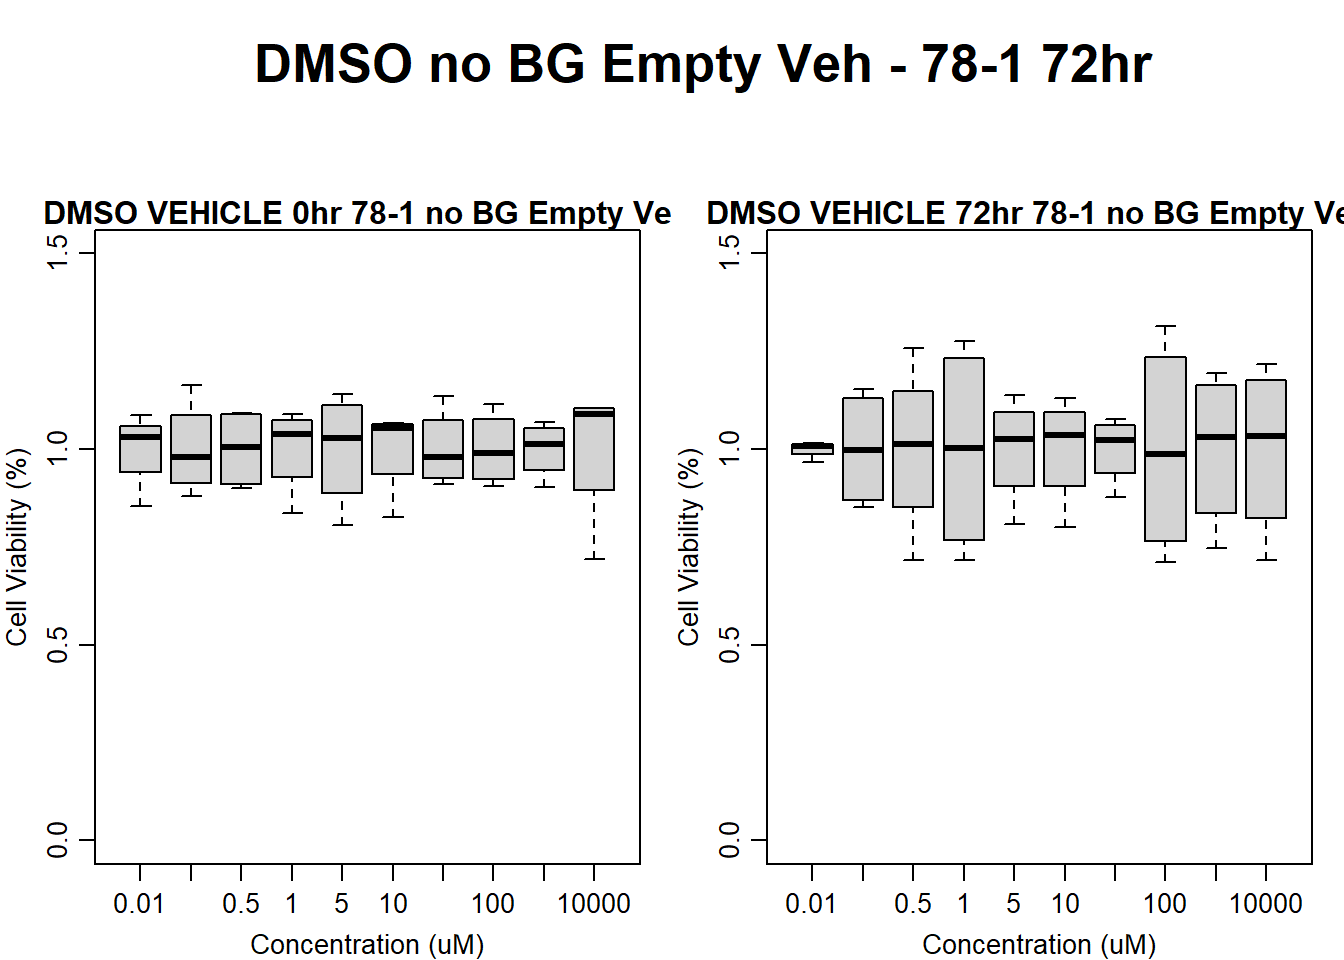
| Version | Author | Date |
|---|---|---|
| 109e14b | emmapfort | 2025-03-03 |
#DMSO 75-1 no BG Empty 72HR
par(mar = c(3.0, 3.0, 1.2, 1), mgp = c(2, .7, 0))
layout(matrix(c(1, 2, 1, 3), nrow = 2, ncol = 2), heights = c(0.5, 2, 2, 2))
#layout.show(3)
plot.new()
text(0.5,0.5,"DMSO no BG Empty Veh - 75-1 72hr",cex = 2,font = 2)

boxplot(dmso72hr75$Ind1_75_In_noBG_Low_Veh ~ dmso72hr75$Conc,
        ylim = c(0, 1.5),
        ylab = "Cell Viability (%)",
        xlab = "Concentration (uM)",
        main = "DMSO VEHICLE 0hr 75-1 no BG Empty Veh"
)

boxplot(dmso72hr75$Ind1_75_Fin_noBG_Low_Veh ~ dmso72hr75$Conc,
        ylim = c(0, 1.5),
        ylab = "Cell Viability (%)",
        xlab = "Concentration (uM)",
        main = "DMSO VEHICLE 72hr 75-1 no BG Empty Veh"
)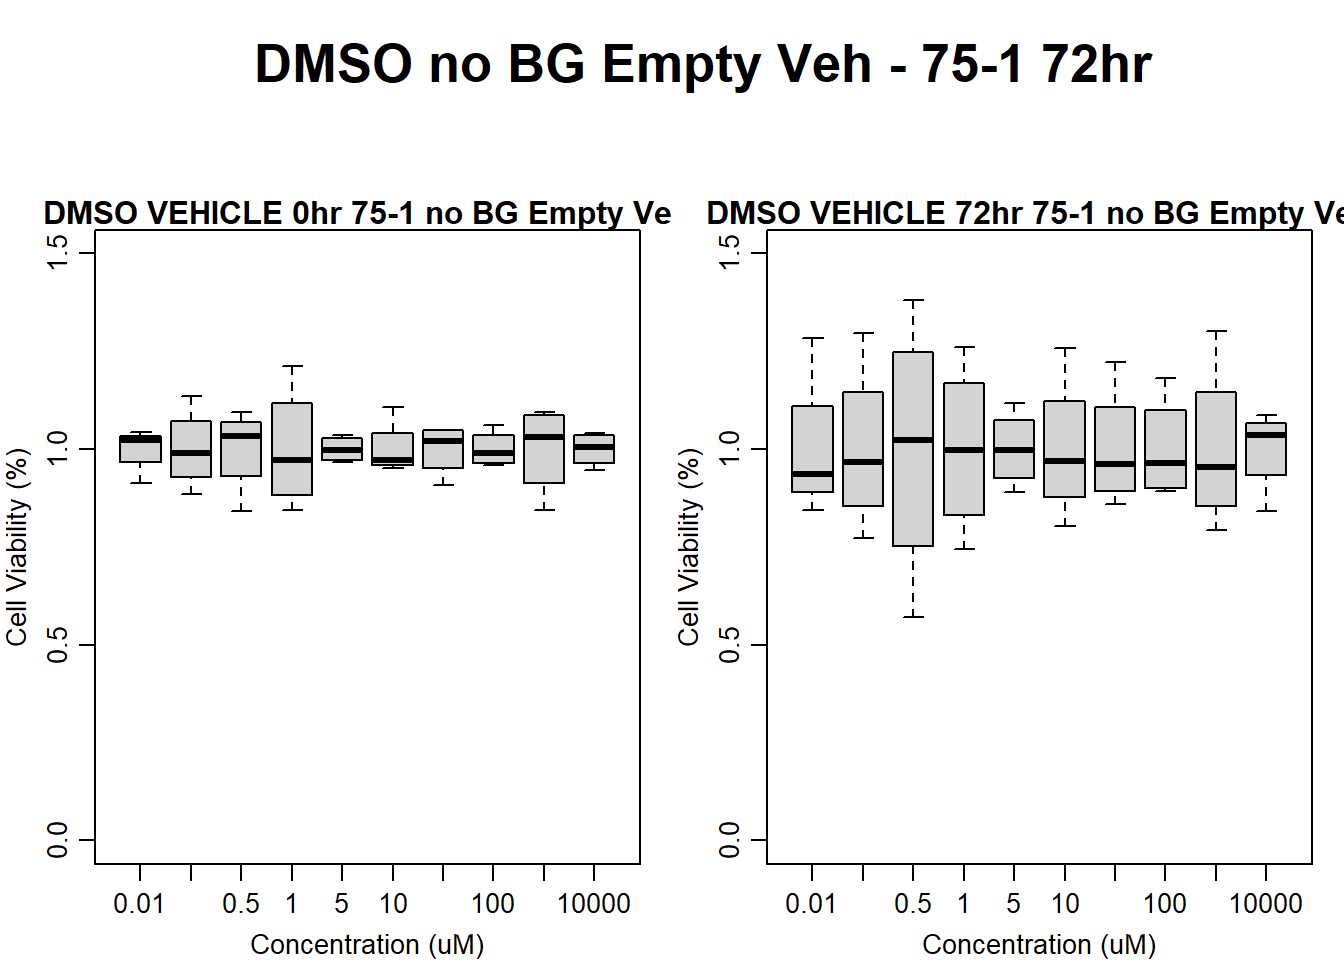
| Version | Author | Date |
|---|---|---|
| 109e14b | emmapfort | 2025-03-03 |
#DMSO 17-3 no BG Empty 72HR
par(mar = c(3.0, 3.0, 1.2, 1), mgp = c(2, .7, 0))
layout(matrix(c(1, 2, 1, 3), nrow = 2, ncol = 2), heights = c(0.5, 2, 2, 2))
#layout.show(3)
plot.new()
text(0.5,0.5,"DMSO no BG Empty Veh - 17-3 72hr",cex = 2,font = 2)

boxplot(dmso72hr17$Ind3_17_In_noBG_Low_Veh ~ dmso72hr17$Conc,
        ylim = c(0, 1.5),
        ylab = "Cell Viability (%)",
        xlab = "Concentration (uM)",
        main = "DMSO VEHICLE 0hr 17-3 no BG Empty Veh"
)

boxplot(dmso72hr17$Ind3_17_Fin_noBG_Low_Veh ~ dmso72hr17$Conc,
        ylim = c(0, 1.5),
        ylab = "Cell Viability (%)",
        xlab = "Concentration (uM)",
        main = "DMSO VEHICLE 72hr 17-3 no BG Empty Veh"
)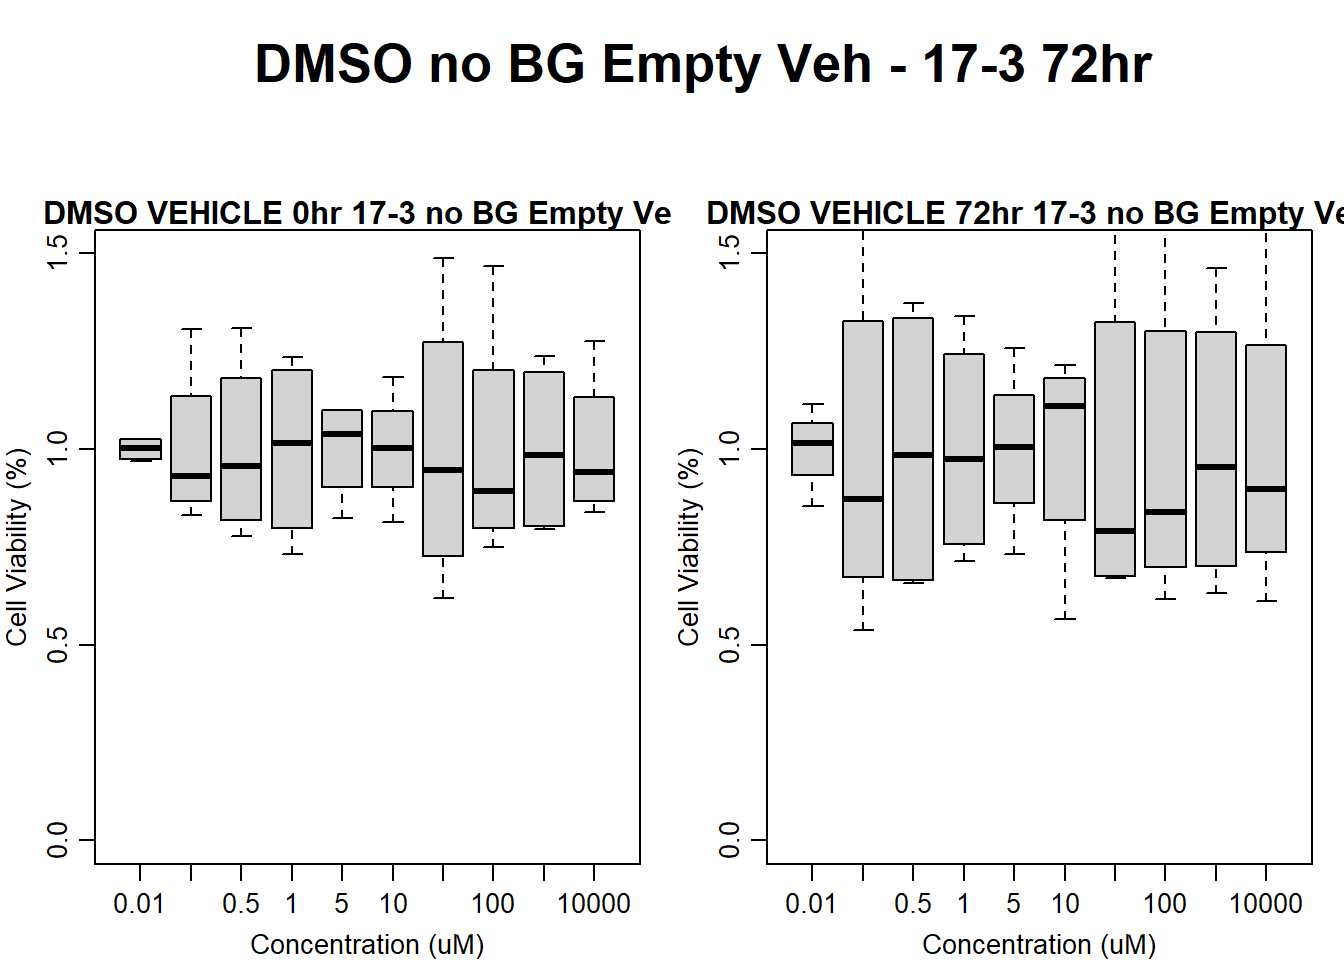
| Version | Author | Date |
|---|---|---|
| 109e14b | emmapfort | 2025-03-03 |
Now for the final step, dividing the final timepoint by the initial baseline reading at 0hr
#####DOX Samples#####
#dox All 24HR
par(mar = c(3.0, 3.0, 1.2, 1), mgp = c(2, .7, 0))
layout(matrix(c(1, 2, 1, 3, 1, 4), nrow = 2, ncol = 3), heights = c(0.5, 2, 2, 2))
#layout.show(3)
plot.new()
text(0.5,0.5,"DOXORUBICIN - 24hr",cex = 2,font = 2)

boxplot(dox24hr78$Ind2_78_Div ~ dox24hr78$Conc,
        ylim = c(0, 1.5),
        ylab = "Cell Viability (%)",
        xlab = "Concentration (uM)",
        main = "78-1 Div"
)

boxplot(dox24hr75$Ind1_75_Div ~ dox24hr75$Conc,
        ylim = c(0, 1.5),
        ylab = "Cell Viability (%)",
        xlab = "Concentration (uM)",
        main = "75-1 Div"
)

boxplot(dox24hr17$Ind3_17_Div ~ dox24hr17$Conc,
        ylim = c(0, 1.5),
        ylab = "Cell Viability (%)",
        xlab = "Concentration (uM)",
        main = "17-3 Div"
)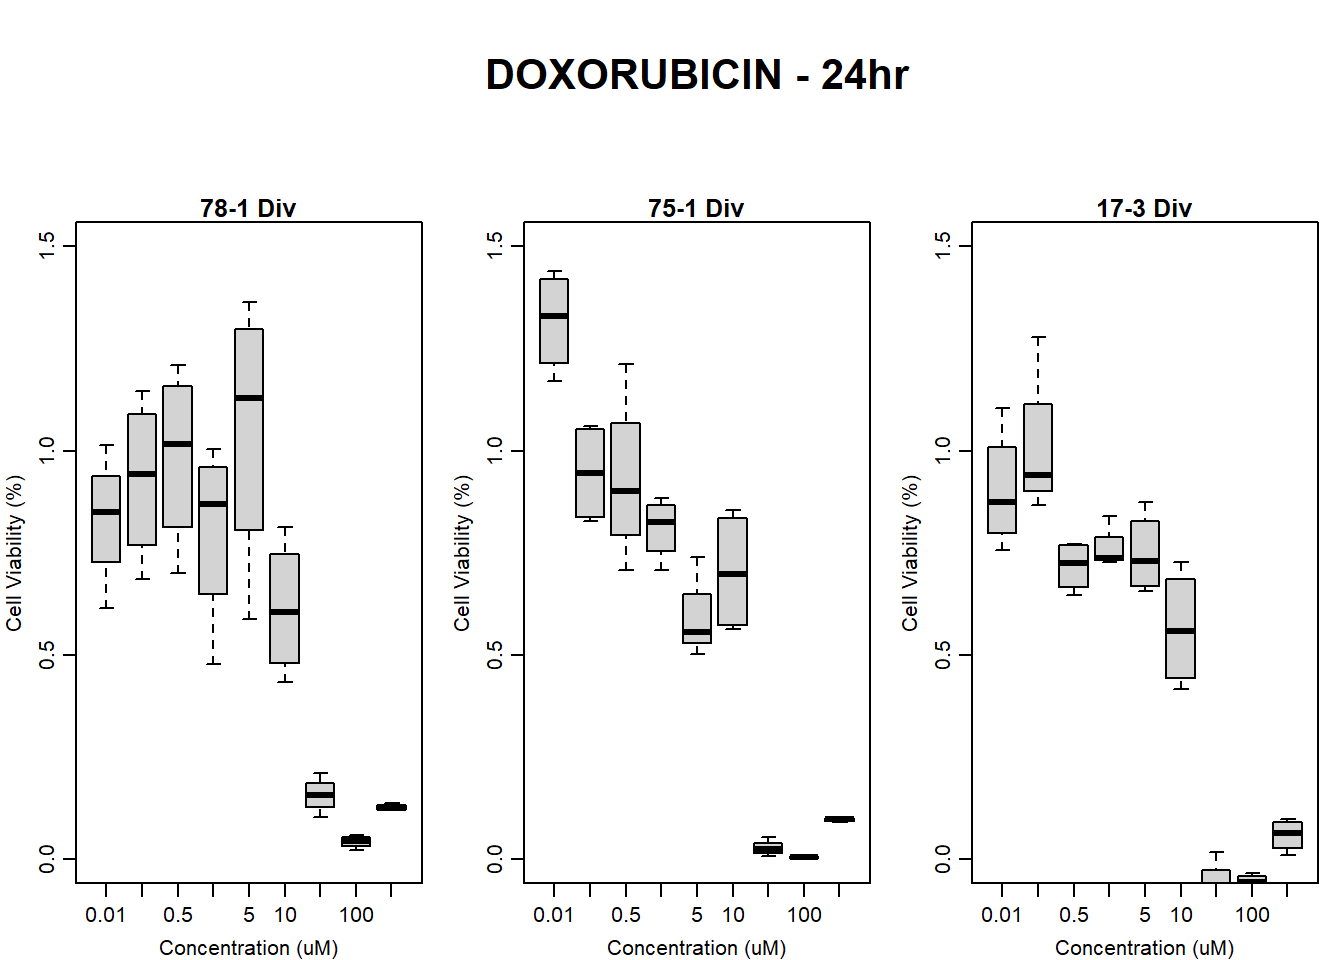
| Version | Author | Date |
|---|---|---|
| 109e14b | emmapfort | 2025-03-03 |
#####FLUO samples#####
par(mar = c(3.0, 3.0, 1.2, 1), mgp = c(2, .7, 0))
layout(matrix(c(1, 2, 1, 3, 1, 4), nrow = 2, ncol = 3), heights = c(0.5, 2, 2, 2))
#layout.show(3)
plot.new()
text(0.5,0.5,"5-FLUOROURACIL - 24hr",cex = 2,font = 2)

boxplot(fluo24hr78$Ind2_78_Div ~ fluo24hr78$Conc,
        ylim = c(0, 1.5),
        ylab = "Cell Viability (%)",
        xlab = "Concentration (uM)",
        main = "78-1 Div"
)

boxplot(fluo24hr75$Ind1_75_Div ~ fluo24hr75$Conc,
        ylim = c(0, 1.5),
        ylab = "Cell Viability (%)",
        xlab = "Concentration (uM)",
        main = "75-1 Div"
)

boxplot(fluo24hr17$Ind3_17_Div ~ fluo24hr17$Conc,
        ylim = c(0, 1.5),
        ylab = "Cell Viability (%)",
        xlab = "Concentration (uM)",
        main = "17-3 Div"
)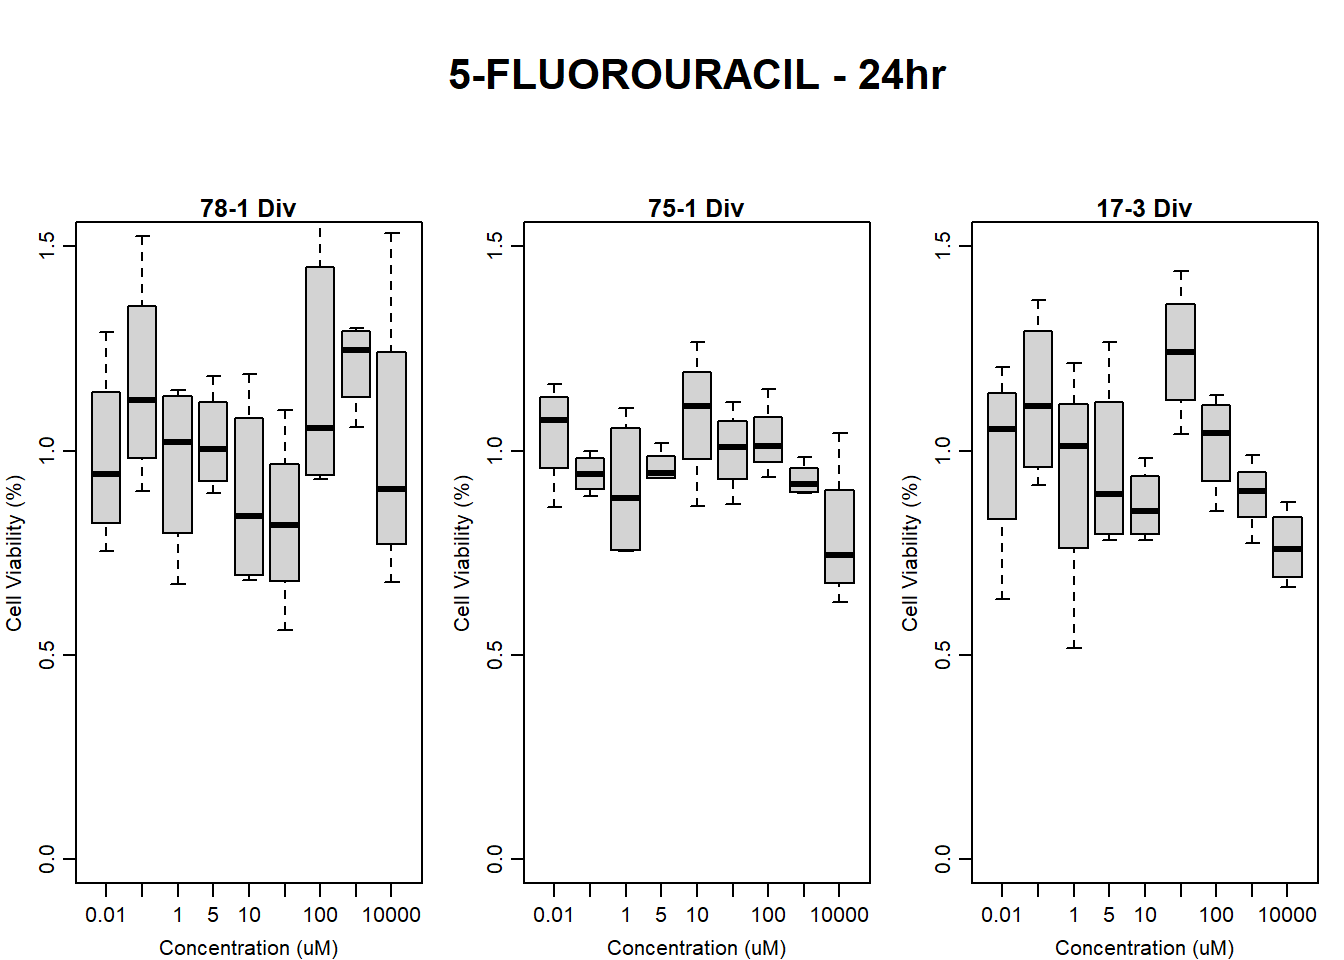
| Version | Author | Date |
|---|---|---|
| 109e14b | emmapfort | 2025-03-03 |
#####DMSO samples#####
#DMSO All 24HR
par(mar = c(3.0, 3.0, 1.2, 1), mgp = c(2, .7, 0))
layout(matrix(c(1, 2, 1, 3, 1, 4), nrow = 2, ncol = 3), heights = c(0.5, 2, 2, 2))
#layout.show(3)
plot.new()
text(0.5,0.5,"DMSO VEHICLE - 24hr",cex = 2,font = 2)

boxplot(dmso24hr78$Ind2_78_Div ~ dmso24hr78$Conc,
        ylim = c(0, 1.5),
        ylab = "Cell Viability (%)",
        xlab = "Concentration (uM)",
        main = "78-1 Div"
)

boxplot(dmso24hr75$Ind1_75_Div ~ dmso24hr75$Conc,
        ylim = c(0, 1.5),
        ylab = "Cell Viability (%)",
        xlab = "Concentration (uM)",
        main = "75-1 Div"
)

boxplot(dmso24hr17$Ind3_17_Div ~ dmso24hr17$Conc,
        ylim = c(0, 1.5),
        ylab = "Cell Viability (%)",
        xlab = "Concentration (uM)",
        main = "17-3 Div"
)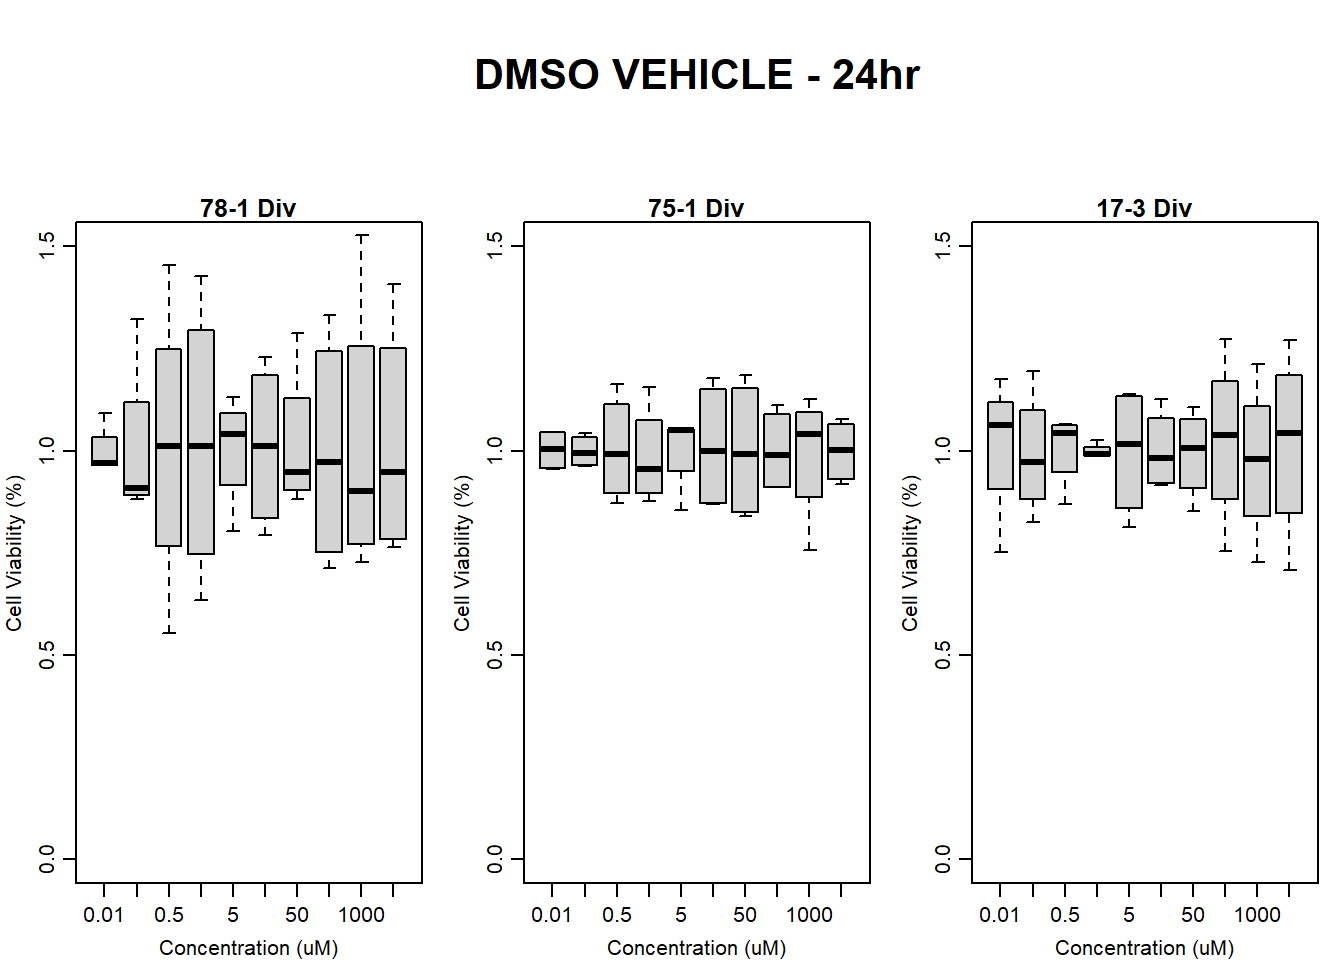
| Version | Author | Date |
|---|---|---|
| 109e14b | emmapfort | 2025-03-03 |
#####DOX Samples#####
#dox All 48HR
par(mar = c(3.0, 3.0, 1.2, 1), mgp = c(2, .7, 0))
layout(matrix(c(1, 2, 1, 3, 1, 4), nrow = 2, ncol = 3), heights = c(0.5, 2, 2, 2))
#layout.show(3)
plot.new()
text(0.5,0.5,"DOXORUBICIN - 48hr",cex = 2,font = 2)

boxplot(dox48hr78$Ind2_78_Div ~ dox48hr78$Conc,
        ylim = c(0, 1.5),
        ylab = "Cell Viability (%)",
        xlab = "Concentration (uM)",
        main = "78-1 Div"
)

boxplot(dox48hr75$Ind1_75_Div ~ dox48hr75$Conc,
        ylim = c(0, 1.5),
        ylab = "Cell Viability (%)",
        xlab = "Concentration (uM)",
        main = "75-1 Div"
)

boxplot(dox48hr17$Ind3_17_Div ~ dox48hr17$Conc,
        ylim = c(0, 1.5),
        ylab = "Cell Viability (%)",
        xlab = "Concentration (uM)",
        main = "17-3 Div"
)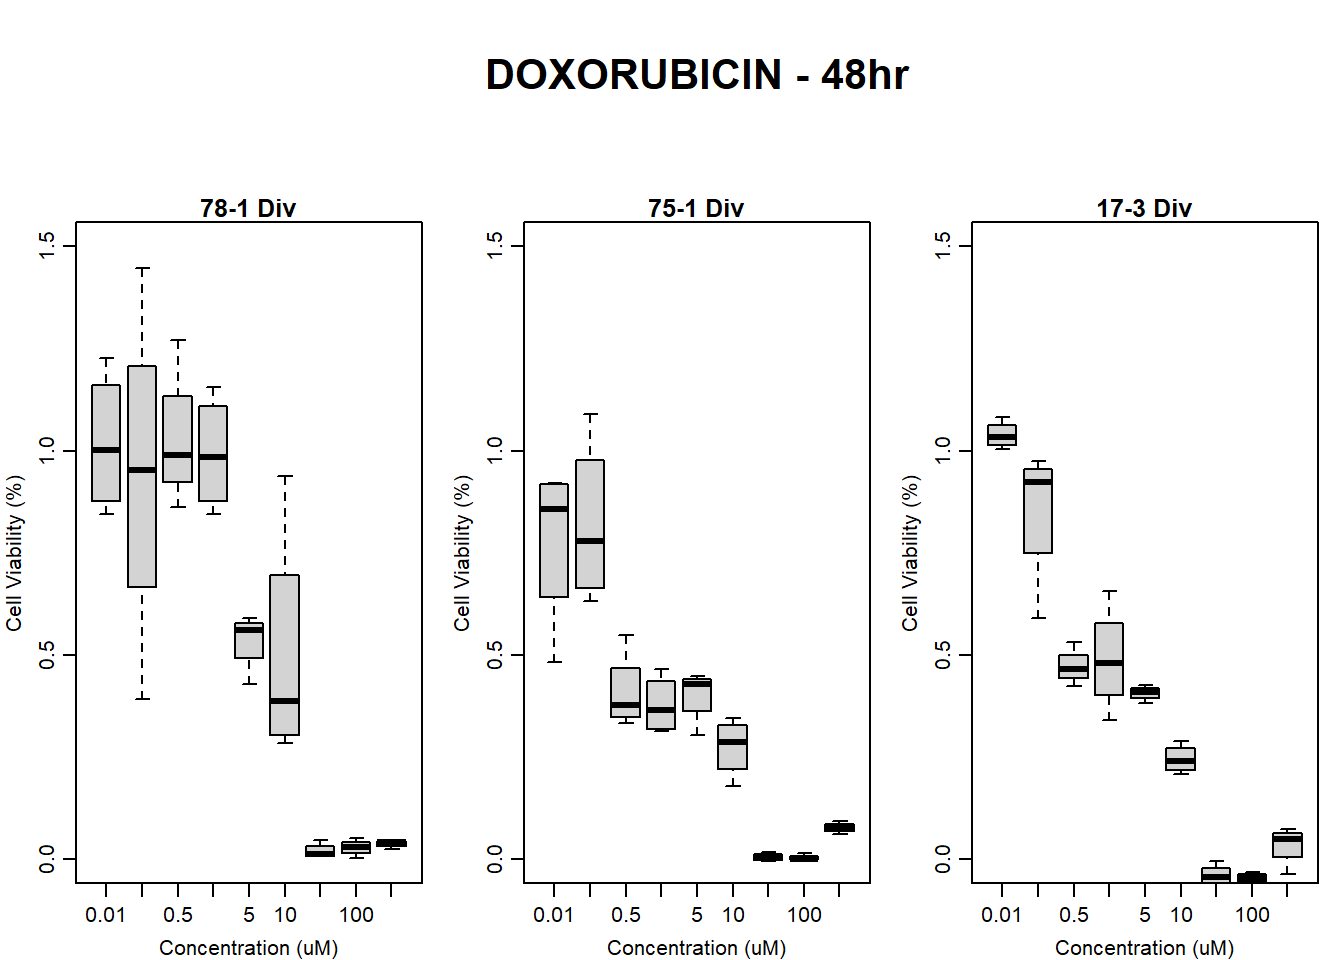
| Version | Author | Date |
|---|---|---|
| 109e14b | emmapfort | 2025-03-03 |
#####FLUO samples#####
par(mar = c(3.0, 3.0, 1.2, 1), mgp = c(2, .7, 0))
layout(matrix(c(1, 2, 1, 3, 1, 4), nrow = 2, ncol = 3), heights = c(0.5, 2, 2, 2))
#layout.show(3)
plot.new()
text(0.5,0.5,"5-FLUOROURACIL - 48hr",cex = 2,font = 2)

boxplot(fluo48hr78$Ind2_78_Div ~ fluo48hr78$Conc,
        ylim = c(0, 1.5),
        ylab = "Cell Viability (%)",
        xlab = "Concentration (uM)",
        main = "78-1 Div"
)

boxplot(fluo48hr75$Ind1_75_Div ~ fluo48hr75$Conc,
        ylim = c(0, 1.5),
        ylab = "Cell Viability (%)",
        xlab = "Concentration (uM)",
        main = "75-1 Div"
)

boxplot(fluo48hr17$Ind3_17_Div ~ fluo48hr17$Conc,
        ylim = c(0, 1.5),
        ylab = "Cell Viability (%)",
        xlab = "Concentration (uM)",
        main = "17-3 Div"
)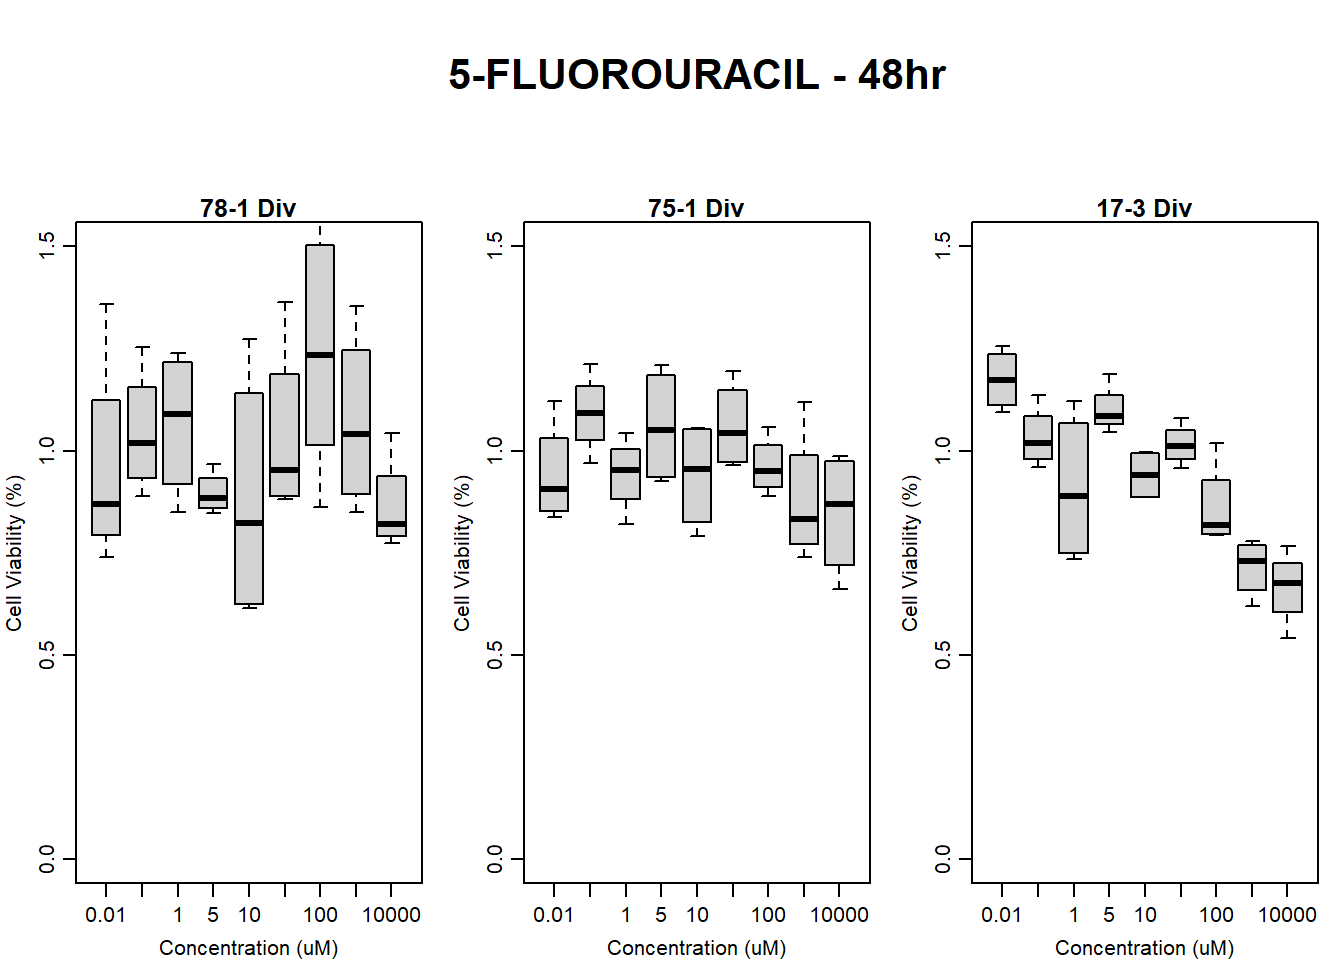
| Version | Author | Date |
|---|---|---|
| 109e14b | emmapfort | 2025-03-03 |
#####DMSO samples#####
#DMSO All 48HR
par(mar = c(3.0, 3.0, 1.2, 1), mgp = c(2, .7, 0))
layout(matrix(c(1, 2, 1, 3, 1, 4), nrow = 2, ncol = 3), heights = c(0.5, 2, 2, 2))
#layout.show(3)
plot.new()
text(0.5,0.5,"DMSO VEHICLE - 48hr",cex = 2,font = 2)

boxplot(dmso48hr78$Ind2_78_Div ~ dmso48hr78$Conc,
        ylim = c(0, 1.5),
        ylab = "Cell Viability (%)",
        xlab = "Concentration (uM)",
        main = "78-1 Div"
)

boxplot(dmso48hr75$Ind1_75_Div ~ dmso48hr75$Conc,
        ylim = c(0, 1.5),
        ylab = "Cell Viability (%)",
        xlab = "Concentration (uM)",
        main = "75-1 Div"
)

boxplot(dmso48hr17$Ind3_17_Div ~ dmso48hr17$Conc,
        ylim = c(0, 1.5),
        ylab = "Cell Viability (%)",
        xlab = "Concentration (uM)",
        main = "17-3 Div"
)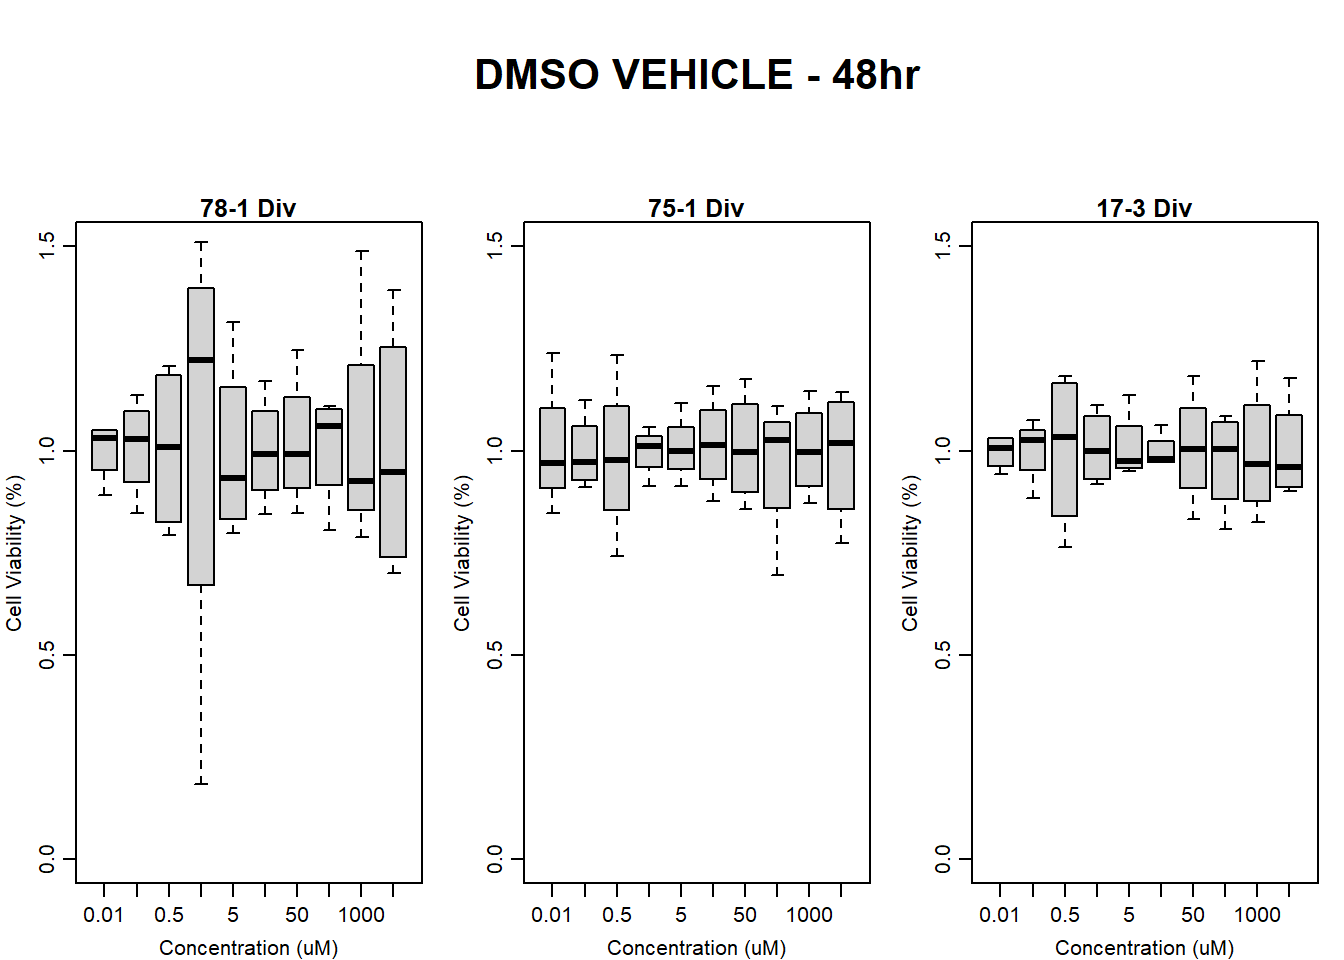
| Version | Author | Date |
|---|---|---|
| 109e14b | emmapfort | 2025-03-03 |
#####DOX Samples#####
#dox All 72HR
par(mar = c(3.0, 3.0, 1.2, 1), mgp = c(2, .7, 0))
layout(matrix(c(1, 2, 1, 3, 1, 4), nrow = 2, ncol = 3), heights = c(0.5, 2, 2, 2))
#layout.show(3)
plot.new()
text(0.5,0.5,"DOXORUBICIN - 72hr",cex = 2,font = 2)

boxplot(dox72hr78$Ind2_78_Div ~ dox72hr78$Conc,
        ylim = c(0, 1.5),
        ylab = "Cell Viability (%)",
        xlab = "Concentration (uM)",
        main = "78-1 Div"
)

boxplot(dox72hr75$Ind1_75_Div ~ dox72hr75$Conc,
        ylim = c(0, 1.5),
        ylab = "Cell Viability (%)",
        xlab = "Concentration (uM)",
        main = "75-1 Div"
)

boxplot(dox72hr17$Ind3_17_Div ~ dox72hr17$Conc,
        ylim = c(0, 1.5),
        ylab = "Cell Viability (%)",
        xlab = "Concentration (uM)",
        main = "17-3 Div"
)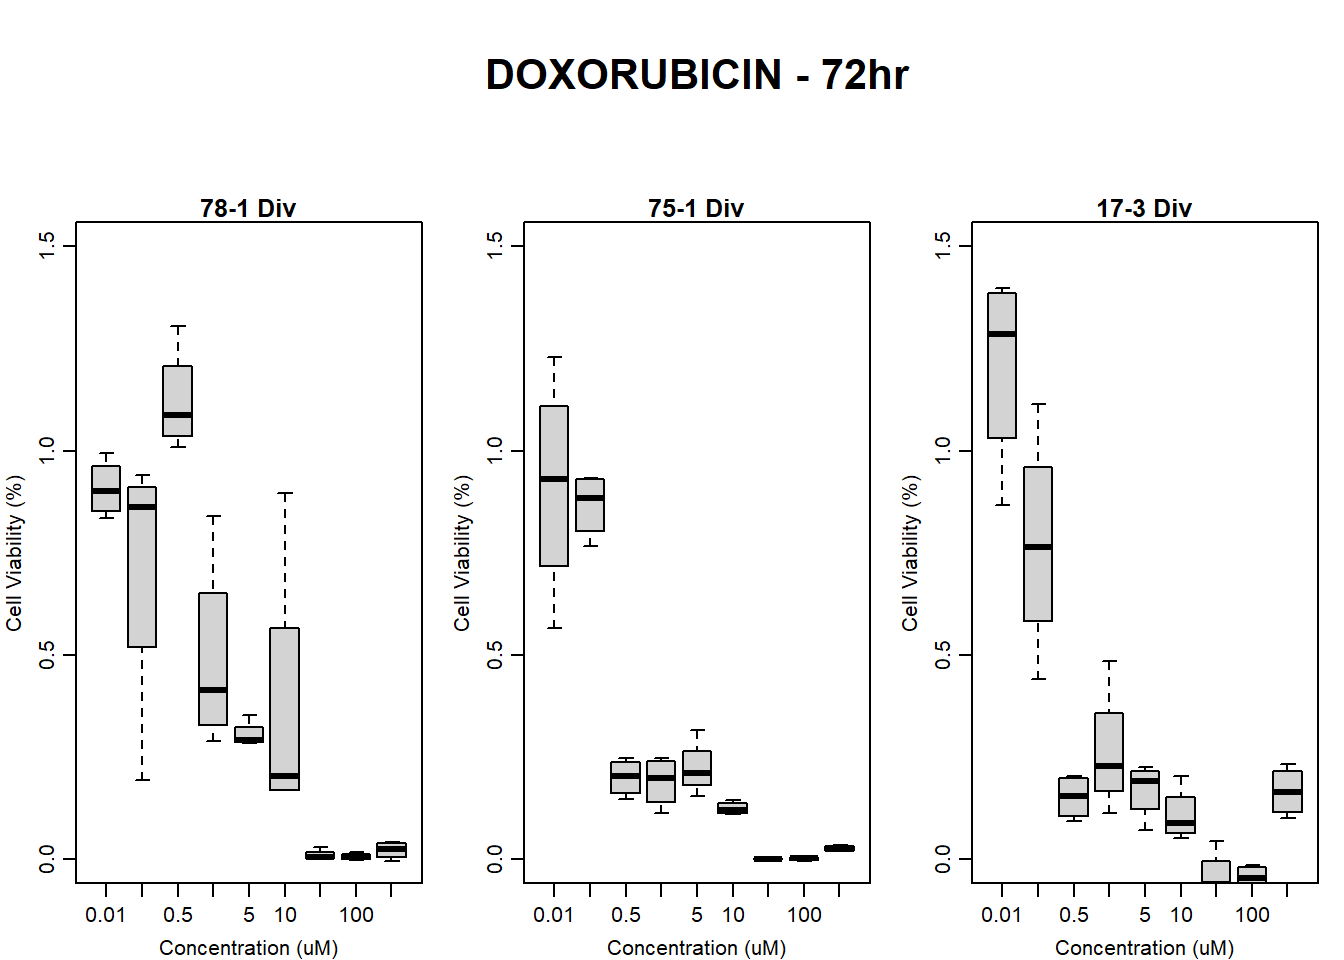
| Version | Author | Date |
|---|---|---|
| 109e14b | emmapfort | 2025-03-03 |
#####FLUO samples#####
par(mar = c(3.0, 3.0, 1.2, 1), mgp = c(2, .7, 0))
layout(matrix(c(1, 2, 1, 3, 1, 4), nrow = 2, ncol = 3), heights = c(0.5, 2, 2, 2))
#layout.show(3)
plot.new()
text(0.5,0.5,"5-FLUOROURACIL - 72hr",cex = 2,font = 2)

boxplot(fluo72hr78$Ind2_78_Div ~ fluo72hr78$Conc,
        ylim = c(0, 1.5),
        ylab = "Cell Viability (%)",
        xlab = "Concentration (uM)",
        main = "78-1 Div"
)

boxplot(fluo72hr75$Ind1_75_Div ~ fluo72hr75$Conc,
        ylim = c(0, 1.5),
        ylab = "Cell Viability (%)",
        xlab = "Concentration (uM)",
        main = "75-1 Div"
)

boxplot(fluo72hr17$Ind3_17_Div ~ fluo72hr17$Conc,
        ylim = c(0, 1.5),
        ylab = "Cell Viability (%)",
        xlab = "Concentration (uM)",
        main = "17-3 Div"
)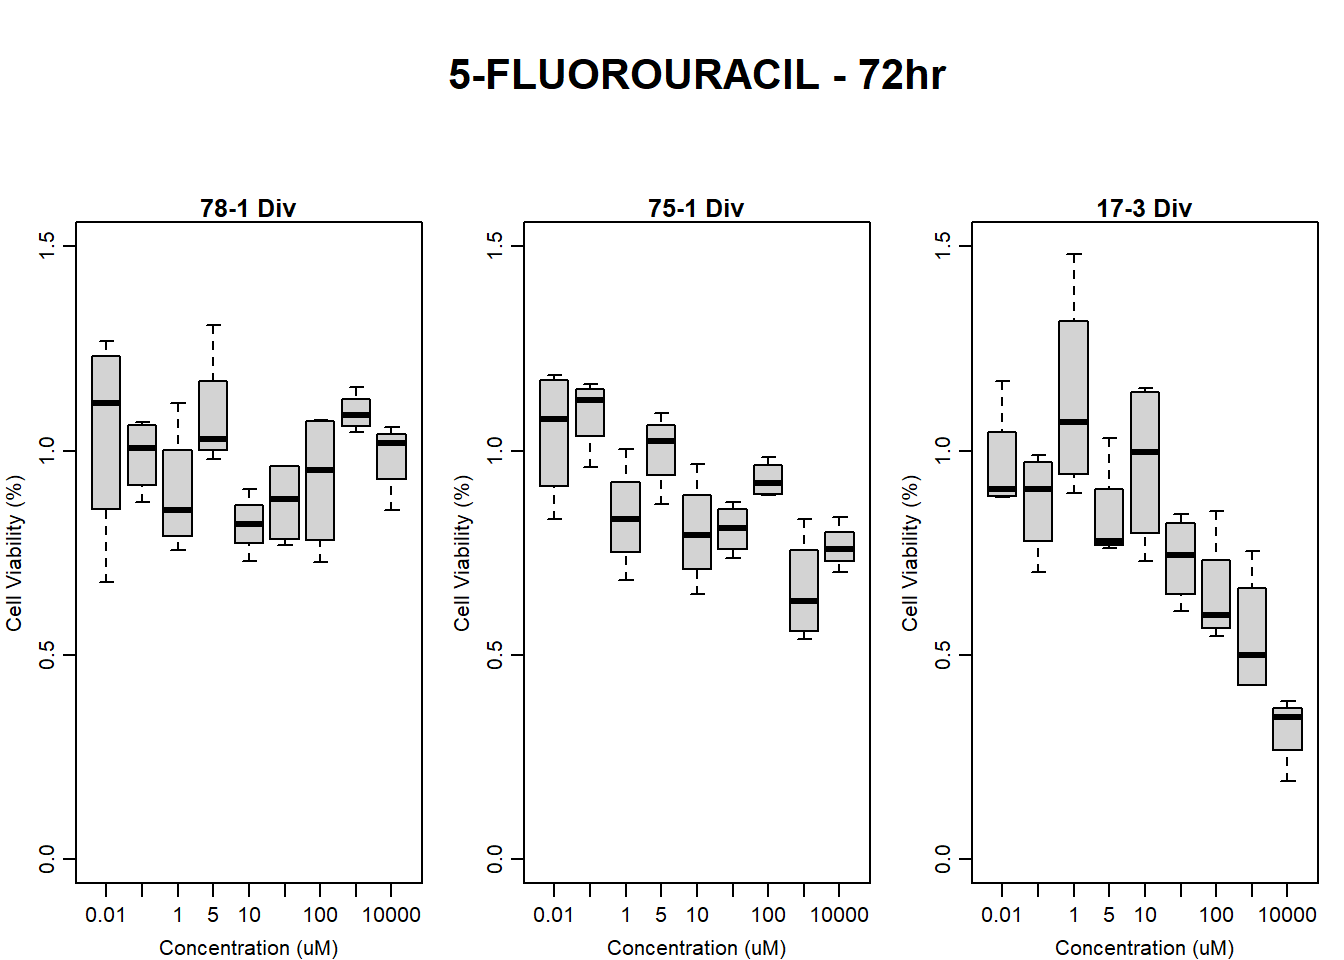
| Version | Author | Date |
|---|---|---|
| 109e14b | emmapfort | 2025-03-03 |
#####DMSO samples#####
#DMSO All 72HR
par(mar = c(3.0, 3.0, 1.2, 1), mgp = c(2, .7, 0))
layout(matrix(c(1, 2, 1, 3, 1, 4), nrow = 2, ncol = 3), heights = c(0.5, 2, 2, 2))
#layout.show(3)
plot.new()
text(0.5,0.5,"DMSO VEHICLE - 72hr",cex = 2,font = 2)

boxplot(dmso72hr78$Ind2_78_Div ~ dmso72hr78$Conc,
        ylim = c(0, 1.5),
        ylab = "Cell Viability (%)",
        xlab = "Concentration (uM)",
        main = "78-1 Div"
)

boxplot(dmso72hr75$Ind1_75_Div ~ dmso72hr75$Conc,
        ylim = c(0, 1.5),
        ylab = "Cell Viability (%)",
        xlab = "Concentration (uM)",
        main = "75-1 Div"
)

boxplot(dmso72hr17$Ind3_17_Div ~ dmso72hr17$Conc,
        ylim = c(0, 1.5),
        ylab = "Cell Viability (%)",
        xlab = "Concentration (uM)",
        main = "17-3 Div"
)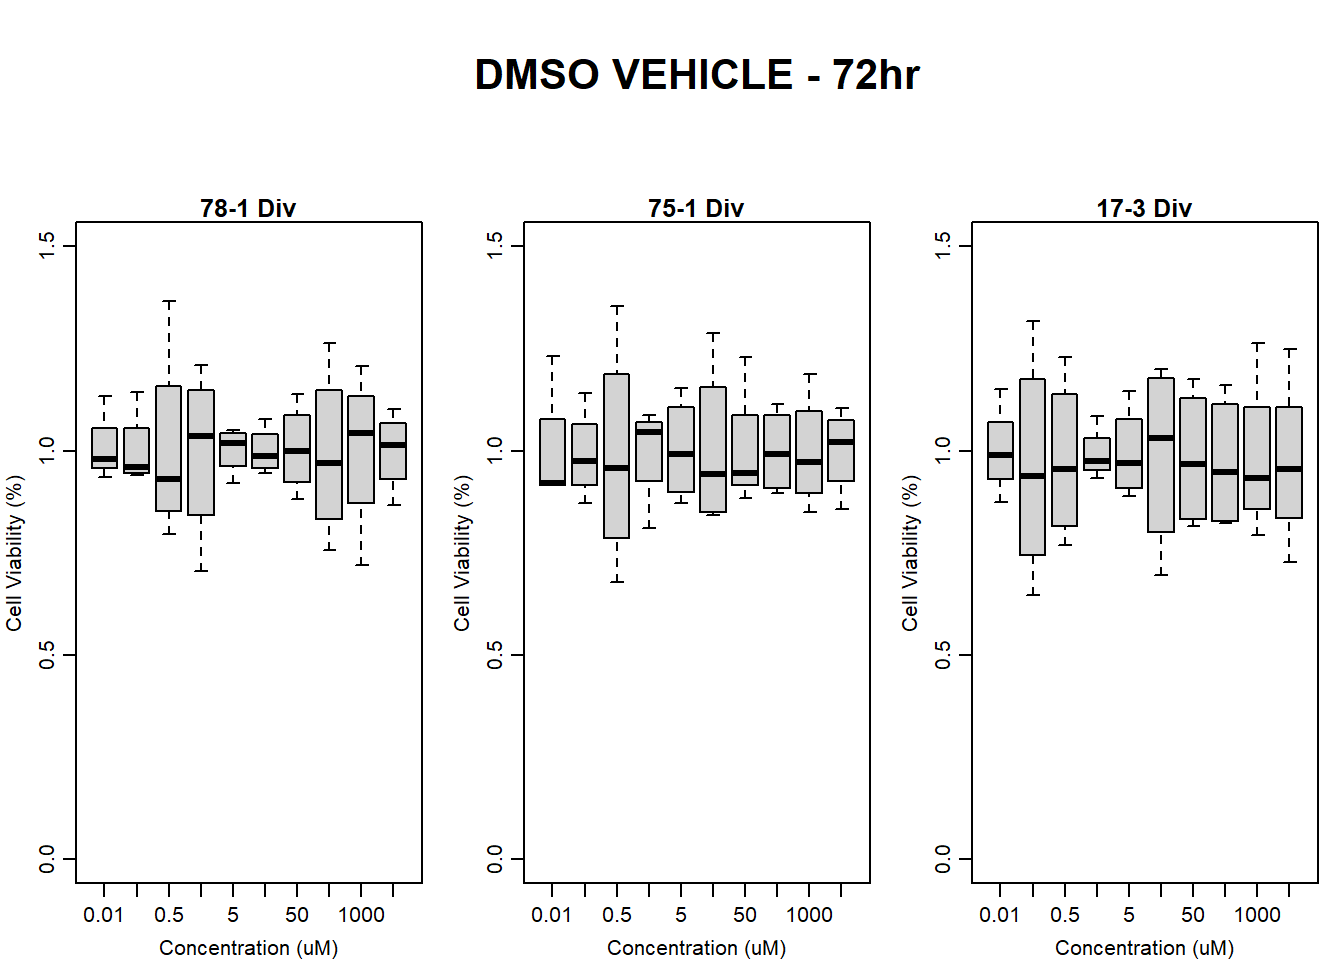
| Version | Author | Date |
|---|---|---|
| 109e14b | emmapfort | 2025-03-03 |
Now that I’ve plotted out all of the analysis steps and nothing looks amiss, let’s start fitting my models for DRC I used the DRC package in R At this point, I am only showing the relevant data for both treatments, as the vehicle has been divided out
#####DOX Samples#####
#24hr DOX
dox24tox_75 <- dox24hr75 %>% mutate(response = Ind1_75_Div*100)
summary(dox24tox_75$response)
Min. 1st Qu. Median Mean 3rd Qu. Max.
0.2582 9.4402 70.8116 60.2731 88.1141 143.8750 dox24tox_78 <- dox24hr78 %>% mutate(response = Ind2_78_Div*100)
summary(dox24tox_78$response) Min. 1st Qu. Median Mean 3rd Qu. Max.
2.304 14.760 68.363 61.596 94.656 136.295 dox24tox_17 <- dox24hr17 %>% mutate(response = Ind3_17_Div*100)
summary(dox24tox_17$response) Min. 1st Qu. Median Mean 3rd Qu. Max.
-12.545 3.773 68.230 51.372 79.390 127.911 #48hr DOX
dox48tox_75 <- dox48hr75 %>% mutate(response = Ind1_75_Div*100)
summary(dox48tox_75$response) Min. 1st Qu. Median Mean 3rd Qu. Max.
-0.5438 7.0099 32.8295 34.9376 46.9964 108.9591 dox48tox_78 <- dox48hr78 %>% mutate(response = Ind2_78_Div*100)
summary(dox48tox_78$response) Min. 1st Qu. Median Mean 3rd Qu. Max.
0.356 4.381 56.012 56.614 94.550 144.755 dox48tox_17 <- dox48hr17 %>% mutate(response = Ind3_17_Div*100)
summary(dox48tox_17$response) Min. 1st Qu. Median Mean 3rd Qu. Max.
-11.355 3.258 39.529 38.204 54.584 108.172 #72hr DOX
dox72tox_75 <- dox72hr75 %>% mutate(response = Ind1_75_Div*100)
summary(dox72tox_75$response) Min. 1st Qu. Median Mean 3rd Qu. Max.
-0.4736 2.2726 15.0670 28.2831 26.5193 122.8151 dox72tox_78 <- dox72hr78 %>% mutate(response = Ind2_78_Div*100)
summary(dox72tox_78$response) Min. 1st Qu. Median Mean 3rd Qu. Max.
-0.5377 2.6397 28.8202 43.8088 87.1758 130.4752 dox72tox_17 <- dox72hr17 %>% mutate(response = Ind3_17_Div*100)
summary(dox72tox_17$response) Min. 1st Qu. Median Mean 3rd Qu. Max.
-11.842 6.646 18.265 30.352 28.511 139.865 #####FLUO Samples#####
#24hr FLUO
fluo24tox_75 <- fluo24hr75 %>% mutate(response = Ind1_75_Div*100)
summary(fluo24tox_75$response) Min. 1st Qu. Median Mean 3rd Qu. Max.
62.91 89.33 97.51 96.54 104.49 126.50 fluo24tox_78 <- fluo24hr78 %>% mutate(response = Ind2_78_Div*100)
summary(fluo24tox_78$response) Min. 1st Qu. Median Mean 3rd Qu. Max.
56.17 88.26 98.50 102.94 118.24 174.12 fluo24tox_17 <- fluo24hr17 %>% mutate(response = Ind3_17_Div*100)
summary(fluo24tox_17$response) Min. 1st Qu. Median Mean 3rd Qu. Max.
51.60 81.22 98.63 97.69 109.90 143.90 #48hr fluo
fluo48tox_75 <- fluo48hr75 %>% mutate(response = Ind1_75_Div*100)
summary(fluo48tox_75$response) Min. 1st Qu. Median Mean 3rd Qu. Max.
66.17 86.65 96.38 96.94 106.33 121.16 fluo48tox_78 <- fluo48hr78 %>% mutate(response = Ind2_78_Div*100)
summary(fluo48tox_78$response) Min. 1st Qu. Median Mean 3rd Qu. Max.
61.42 84.96 95.34 100.91 117.15 170.63 fluo48tox_17 <- fluo48hr17 %>% mutate(response = Ind3_17_Div*100)
summary(fluo48tox_17$response) Min. 1st Qu. Median Mean 3rd Qu. Max.
54.16 77.44 99.37 93.46 108.00 125.49 #72hr fluo
fluo72tox_75 <- fluo72hr75 %>% mutate(response = Ind1_75_Div*100)
summary(fluo72tox_75$response) Min. 1st Qu. Median Mean 3rd Qu. Max.
53.78 77.13 85.58 88.18 99.53 118.57 fluo72tox_78 <- fluo72hr78 %>% mutate(response = Ind2_78_Div*100)
summary(fluo72tox_78$response) Min. 1st Qu. Median Mean 3rd Qu. Max.
67.82 83.26 99.48 96.85 107.07 130.66 fluo72tox_17 <- fluo72hr17 %>% mutate(response = Ind3_17_Div*100)
summary(fluo72tox_17$response) Min. 1st Qu. Median Mean 3rd Qu. Max.
19.08 60.08 79.20 78.08 92.94 148.16 Now that I’ve fit the models and taken a look at their summary, let’s plot some dose-response curves through the DRC package
I would like to have all individuals on the same plot, for each timepoint
par(mar = c(3.0, 3.0, 1.2, 1), mgp = c(2, .7, 0))
layout(matrix(c(1, 2, 1, 3, 1, 4), nrow = 2, ncol = 3), heights = c(0.3, 1, 1, 1))
#layout.show(3)
plot.new()
text(0.5,0.5,"DOXORUBICIN RECOVERY CONCENTRATION-RESPONSE",cex = 2,font = 2)
#24hr plots
doxtox24_75_model <- drm(response~Conc, data = dox24tox_75, fct = LL.4(fixed = c(NA, 0, 100, NA)))
plot(doxtox24_75_model, type = "none", broken = TRUE,
     xt = c(0.01, 0.1, 0.5, 1, 5, 10, 50, 100, 1000), xttrim = FALSE,
     ylim = c(0,110), cex = 1, col = "#9ACCDE", lwd = 4, ylab = "Percent Viability (%)",
     xlab = "Concentration (uM)", main = "24HR FOLLOWING TREATMENT", lty = c(1),
     xaxs = "i", yaxs = "i")

par(new=TRUE)
doxtox24_78_model <- drm(response~Conc, data = dox24tox_78, fct = LL.4(fixed = c(NA, 0, 100, NA)))
plot(doxtox24_78_model, add = TRUE, col = "#499FBD", lwd = 4, lty = c(1), type = "none")

par(new=TRUE)
doxtox24_17_model <- drm(response~Conc, data = dox24tox_17, fct = LL.4(fixed = c(NA, 0, 100, NA)))
plot(doxtox24_17_model, add = TRUE, col = "#254F5E", lwd = 4, lty = c(1), type = "none")

par(new=TRUE)
legend(x = "bottomleft", legend = c("75-1", "78-1", "17-3"), lty = c(1, 1, 1, 1), col = c("#9ACCDE", "#499FBD", "#254F5E"), lwd = 4, cex = 1, title = "iPSC-CM Lines")

#48hr plots
doxtox48_75_model <- drm(response~Conc, data = dox48tox_75, fct = LL.4(fixed = c(NA, NA, 100, NA)))
plot(doxtox48_75_model, type = "none", broken = TRUE,
     xt = c(0.01, 0.1, 0.5, 1, 5, 10, 50, 100, 1000), xttrim = FALSE,
     ylim = c(0,110), cex = 1, col = "#9ACCDE", lwd = 4, ylab = "Percent Viability (%)", xlab = "Concentration (uM)", main = "48HR FOLLOWING TREATMENT", lty = c(2),
     xaxs = "i", yaxs = "i")

par(new=TRUE)
doxtox48_78_model <- drm(response~Conc, data = dox48tox_78, fct = LL.4(fixed = c(NA, NA, NA, NA)))
plot(doxtox48_78_model, add = TRUE, col = "#499FBD", lwd = 4, lty = c(2), type = "none")

par(new=TRUE)
doxtox48_17_model <- drm(response~Conc, data = dox48tox_17, fct = LL.4(fixed = c(NA, 0, 100, NA)))
plot(doxtox48_17_model, add = TRUE, col = "#254F5E", lwd = 4, lty = c(2), type = "none")

#72hr plots
doxtox72_75_model <- drm(response~Conc, data = dox72tox_75, fct = LL.4(fixed = c(NA, NA, 100, NA)))
plot(doxtox72_75_model, type = "none", broken = TRUE,
     xt = c(0.01, 0.1, 0.5, 1, 5, 10, 50, 100, 1000), xttrim = FALSE,
     ylim = c(0, 110), cex = 1, col = "#9ACCDE", lwd = 4, ylab = "Percent Viability (%)",
     xlab = "Concentration (uM)", main = "72HR FOLLOWING TREATMENT", lty = c(3),
     xaxs = "i", yaxs = "i")

par(new=TRUE)
doxtox72_78_model <- drm(response~Conc, data = dox72tox_78, fct = LL.4(fixed = c(NA, 0, 100, NA)))
plot(doxtox72_78_model, add = TRUE, col = "#499FBD", lwd = 4, lty = c(3), type = "none")

par(new=TRUE)
doxtox72_17_model <- drm(response~Conc, data = dox72tox_17, fct = LL.4(fixed = c(NA, 0, 100, NA)))
plot(doxtox72_17_model, add = TRUE, col = "#254F5E", lwd = 4, lty = c(3), type = "none")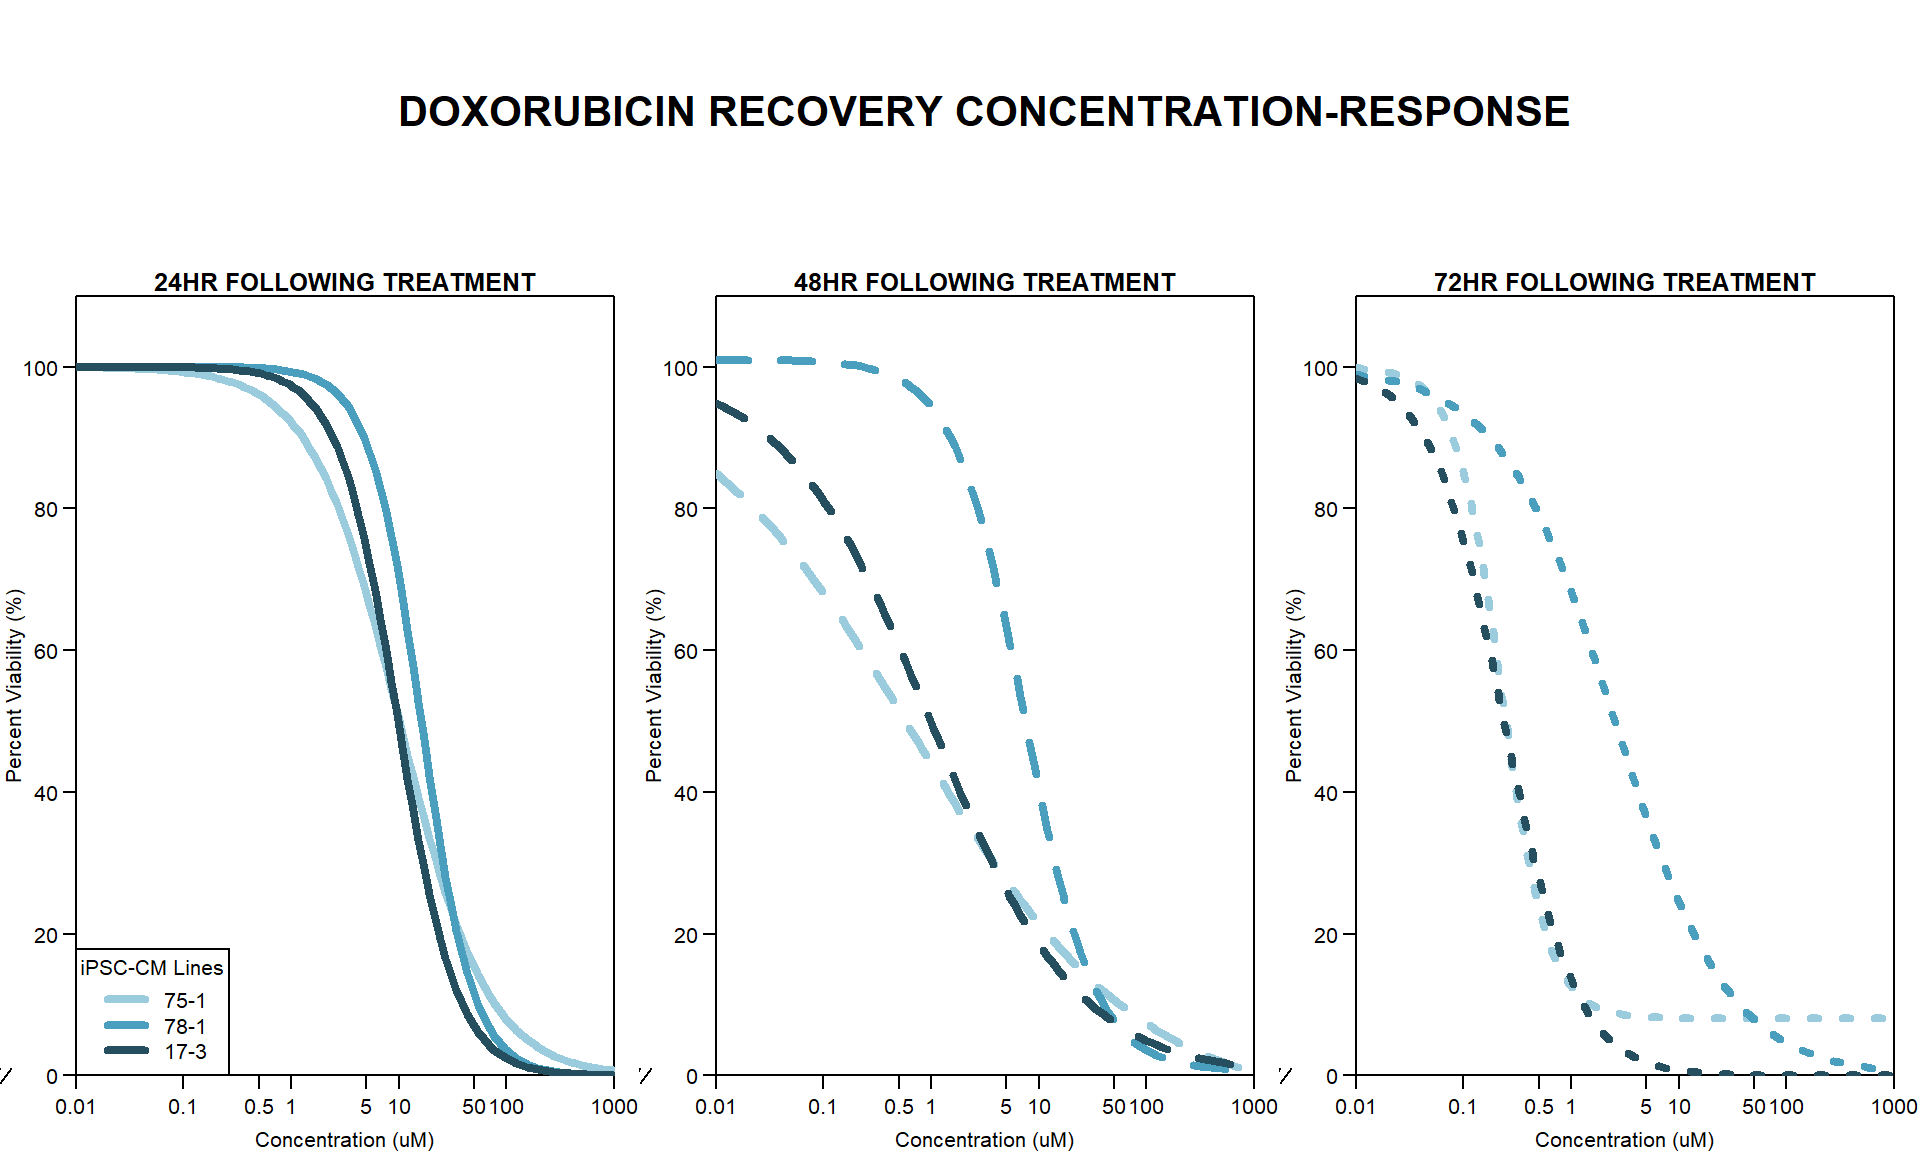
| Version | Author | Date |
|---|---|---|
| 109e14b | emmapfort | 2025-03-03 |
par(mar = c(3.0, 3.0, 1.2, 1), mgp = c(2, .7, 0))
layout(matrix(c(1, 2, 1, 3, 1, 4), nrow = 2, ncol = 3), heights = c(0.3, 1, 1, 1))
#layout.show(3)
plot.new()
text(0.5,0.5,"5-FLUOROURACIL RECOVERY CONCENTRATION-RESPONSE",cex = 2,font = 2)
#24hr plots
fluotox24_75_model <- drm(response~Conc, data = fluo24tox_75, fct = LL.4(fixed = c(NA, NA, NA, NA)))
plot(fluotox24_75_model, type = "none", broken = TRUE,
     xt = c(0.01, 0.1, 1, 5, 10, 50, 100, 1000, 10000), xttrim = FALSE,
     ylim = c(0,110), cex = 1, col = "#DCACED", lwd = 4, ylab = "Percent Viability (%)",
     xlab = "Concentration (uM)", main = "24HR FOLLOWING TREATMENT", lty = c(1),
     xaxs = "i", yaxs = "i")

par(new=TRUE)
fluotox24_78_model <- drm(response~Conc, data = fluo24tox_78, fct = LL.4(fixed = c(NA, 0, 100, NA)))
plot(fluotox24_78_model, add = TRUE, col = "#674C71", lwd = 4, lty = c(1), type = "none")

par(new=TRUE)
fluotox24_17_model <- drm(response~Conc, data = fluo24tox_17, fct = LL.4(fixed = c(NA, NA, NA, NA)))
plot(fluotox24_17_model, add = TRUE, col = "#EACDF4", lwd = 4, lty = c(1), type = "none")

par(new=TRUE)
legend(x = "bottomleft", legend = c("75-1", "78-1", "17-3"), lty = c(1, 1, 1, 1), col = c("#DCACED", "#674C71", "#EACDF4"), lwd = 4, cex = 1, title = "iPSC-CM Lines")

#48hr plots
fluotox48_75_model <- drm(response~Conc, data = fluo48tox_75, fct = LL.4(fixed = c(NA, NA, NA, NA)))
plot(fluotox48_75_model, type = "none", broken = TRUE,
     xt = c(0.01, 0.1, 1, 5, 10, 50, 100, 1000, 10000), xttrim = FALSE,
     ylim = c(0,110), cex = 1, col = "#DCACED", lwd = 4, ylab = "Percent Viability (%)", xlab = "Concentration (uM)", main = "48HR FOLLOWING TREATMENT", lty = c(2),
     xaxs = "i", yaxs = "i")

par(new=TRUE)
fluotox48_78_model <- drm(response~Conc, data = fluo48tox_78, fct = LL.4(fixed = c(NA, NA, NA, NA)))
plot(fluotox48_78_model, add = TRUE, col = "#674C71", lwd = 4, lty = c(2), type = "none")

par(new=TRUE)
fluotox48_17_model <- drm(response~Conc, data = fluo48tox_17, fct = LL.4(fixed = c(NA, NA, 100, NA)))
plot(fluotox48_17_model, add = TRUE, col = "#EACDF4", lwd = 4, lty = c(2), type = "none")

#72hr plots
fluotox72_75_model <- drm(response~Conc, data = fluo72tox_75, fct = LL.4(fixed = c(NA, NA, 100, NA)))
plot(fluotox72_75_model, type = "none", broken = TRUE,
     xt = c(0.01, 0.1, 1, 5, 10, 50, 100, 1000, 10000), xttrim = FALSE,
     ylim = c(0, 110), cex = 1, col = "#DCACED", lwd = 4, ylab = "Percent Viability (%)",
     xlab = "Concentration (uM)", main = "72HR FOLLOWING TREATMENT", lty = c(3),
     xaxs = "i", yaxs = "i")

par(new=TRUE)
fluotox72_78_model <- drm(response~Conc, data = fluo72tox_78, fct = LL.4(fixed = c(NA, NA, 100, NA)))
plot(fluotox72_78_model, add = TRUE, col = "#674C71", lwd = 4, lty = c(3), type = "none")

par(new=TRUE)
fluotox72_17_model <- drm(response~Conc, data = fluo72tox_17, fct = LL.4(fixed = c(NA, NA, NA, NA)))
plot(fluotox72_17_model, add = TRUE, col = "#EACDF4", lwd = 4, lty = c(3), type = "none")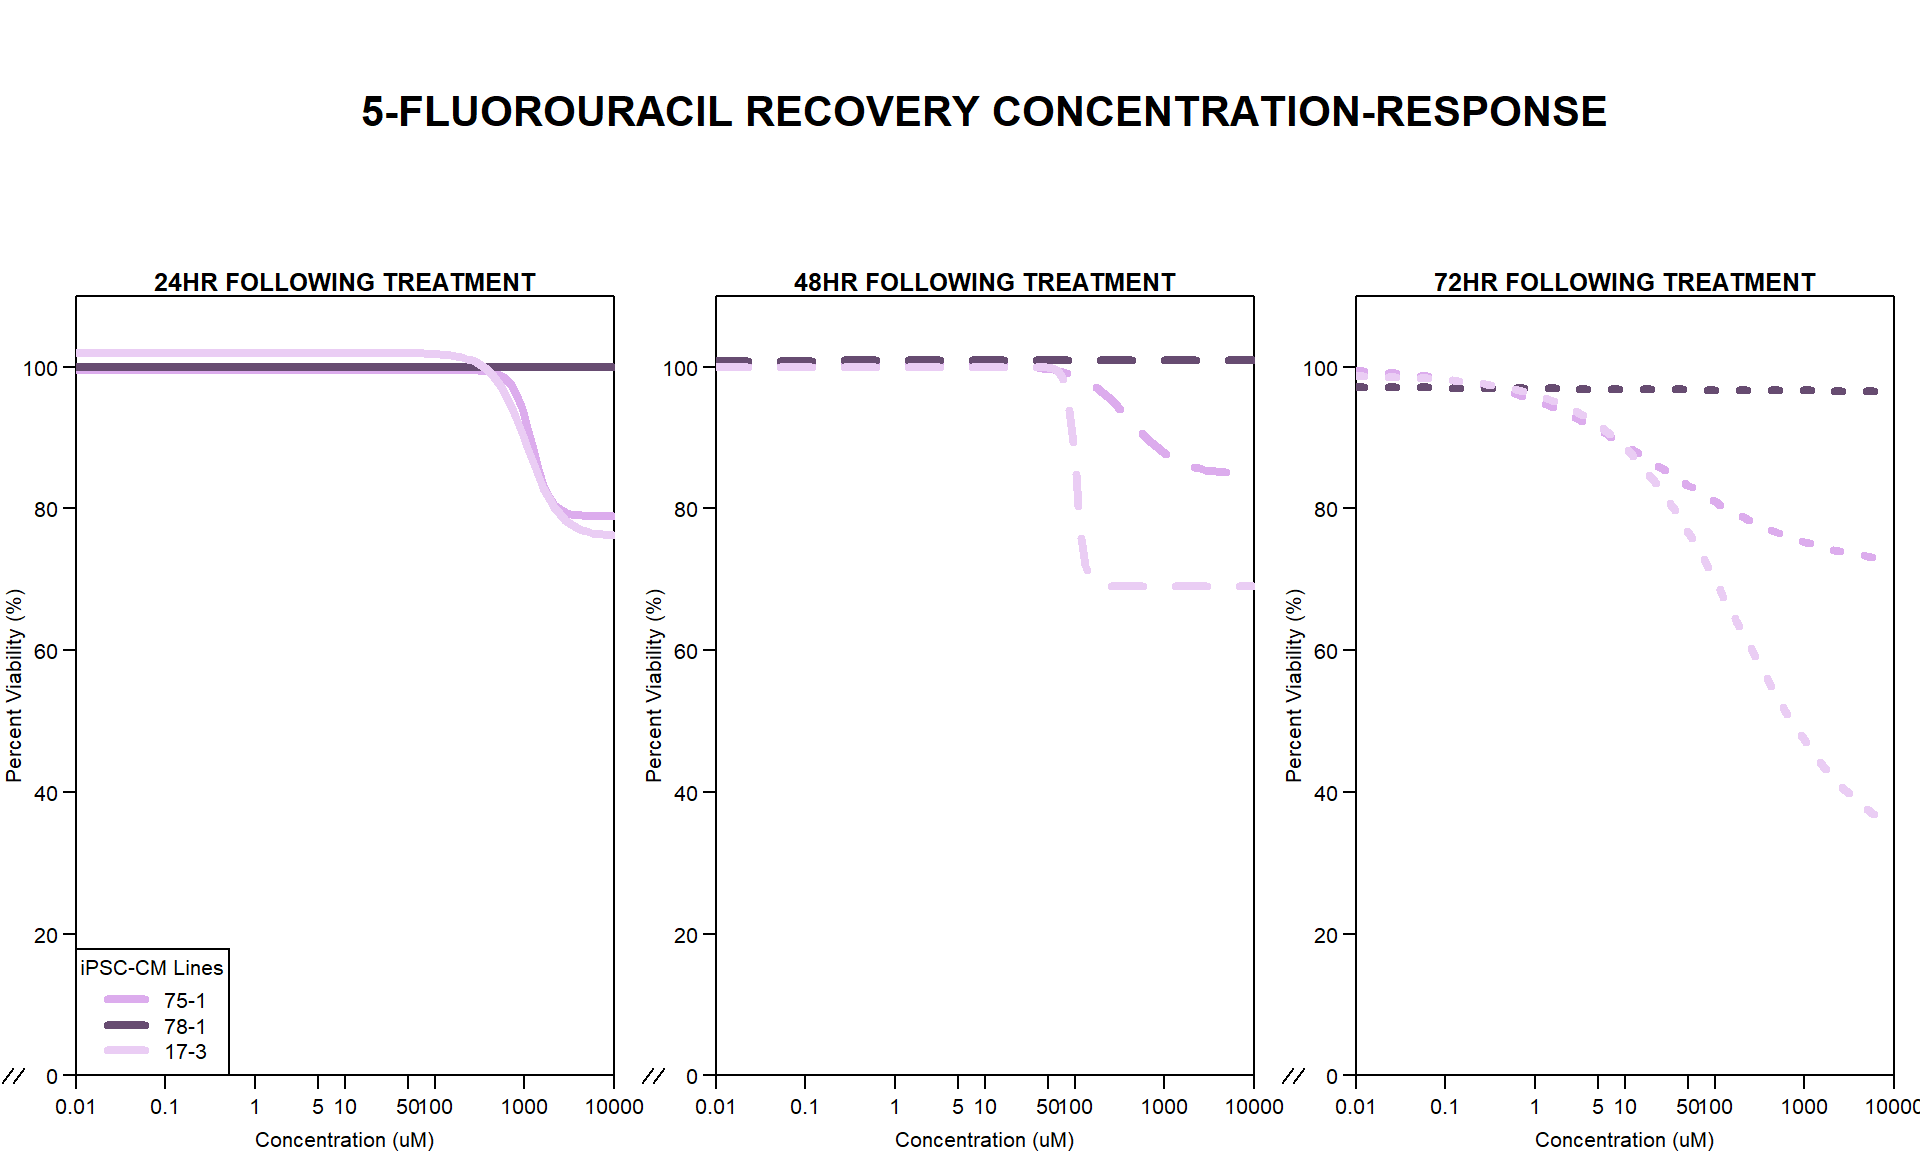
| Version | Author | Date |
|---|---|---|
| 109e14b | emmapfort | 2025-03-03 |
Test to see if I can plot all of these on the same plot using colors and lines
#for this to work I need to find unique lines/colors for all of these
#this will include 5-Fluorouracil and Doxorubicin

par(mar = c(3.0, 3.0, 1.2, 1), mgp = c(2, .7, 0))
layout(matrix(c(1, 2, 1, 3), nrow = 2, ncol = 2), heights = c(0.4, 2, 2, 2))
#layout.show(3)
plot.new()
text(0.5,0.5,"RECOVERY CONCENTRATION-RESPONSE",cex = 2,font = 2)
#24hr plots
doxtox24_75_model <- drm(response~Conc, data = dox24tox_75, fct = LL.4(fixed = c(NA, 0, 100, NA)))
plot(doxtox24_75_model, type = "none", broken = TRUE,
     xt = c(0.01, 0.1, 0.5, 1, 5, 10, 50, 100, 1000), xttrim = FALSE,
     ylim = c(0,110), cex = 1, col = "#9ACCDE", lwd = 4, ylab = "Percent Viability (%)",
     xlab = "Concentration (uM)", main = "24HR FOLLOWING TREATMENT", lty = c(1),
     xaxs = "i", yaxs = "i")

par(new=TRUE)
doxtox24_78_model <- drm(response~Conc, data = dox24tox_78, fct = LL.4(fixed = c(NA, 0, 100, NA)))
plot(doxtox24_78_model, add = TRUE, col = "#499FBD", lwd = 4, lty = c(1), type = "none")

par(new=TRUE)
doxtox24_17_model <- drm(response~Conc, data = dox24tox_17, fct = LL.4(fixed = c(NA, 0, 100, NA)))
plot(doxtox24_17_model, add = TRUE, col = "#254F5E", lwd = 4, lty = c(1), type = "none")

#48hr plots
par(new=TRUE)
doxtox48_75_model <- drm(response~Conc, data = dox48tox_75, fct = LL.4(fixed = c(NA, NA, 100, NA)))
plot(doxtox48_75_model, add = TRUE, col = "#9ACCDE", lwd = 4, lty = c(2), type = "none")

par(new=TRUE)
doxtox48_78_model <- drm(response~Conc, data = dox48tox_78, fct = LL.4(fixed = c(NA, NA, 100, NA)))
plot(doxtox48_78_model, add = TRUE, col = "#499FBD", lwd = 4, lty = c(2), type = "none")

par(new=TRUE)
doxtox48_17_model <- drm(response~Conc, data = dox48tox_17, fct = LL.4(fixed = c(NA, 0, 100, NA)))
plot(doxtox48_17_model, add = TRUE, col = "#254F5E", lwd = 4, lty = c(2), type = "none")

#72hr plots
par(new=TRUE)
doxtox72_75_model <- drm(response~Conc, data = dox72tox_75, fct = LL.4(fixed = c(NA, NA, 100, NA)))
plot(doxtox72_75_model, add = TRUE, col = "#9ACCDE", lwd = 4, lty = c(3), type = "none")

par(new=TRUE)
doxtox72_78_model <- drm(response~Conc, data = dox72tox_78, fct = LL.4(fixed = c(NA, 0, 100, NA)))
plot(doxtox72_78_model, add = TRUE, col = "#499FBD", lwd = 4, lty = c(3), type = "none")

par(new=TRUE)
doxtox72_17_model <- drm(response~Conc, data = dox72tox_17, fct = LL.4(fixed = c(NA, 0, 100, NA)))
plot(doxtox72_17_model, add = TRUE, col = "#254F5E", lwd = 4, lty = c(3), type = "none")

par(new=TRUE)
legend(x = "bottomleft", legend = c("Ind1 24hr", "Ind2 24hr", "Ind3 24hr", "Ind1 48hr", "Ind2 48hr", "Ind3 48hr", "Ind1 72hr", "Ind2 72hr", "Ind3 72hr"), lty = c(1, 1, 1, 2, 2, 2, 3, 3, 3, 1), col = rep(c("#9ACCDE", "#499FBD", "#254F5E"),3), lwd = 4, cex = 1)

#now add the fluo plots
#24hr plots
fluotox24_75_model <- drm(response~Conc, data = fluo24tox_75, fct = LL.4(fixed = c(NA, NA, NA, NA)))
plot(fluotox24_75_model, type = "none", broken = TRUE,
     xt = c(0.01, 0.1, 1, 5, 10, 50, 100, 1000, 10000), xttrim = FALSE,
     ylim = c(0,110), cex = 1, col = "#DCACED", lwd = 4, ylab = "Percent Viability (%)",
     xlab = "Concentration (uM)", main = "5-FLUOROURACIL TREATMENT", lty = c(1),
     xaxs = "i", yaxs = "i")

par(new=TRUE)
fluotox24_78_model <- drm(response~Conc, data = fluo24tox_78, fct = LL.4(fixed = c(NA, 0, 100, NA)))
plot(fluotox24_78_model, add = TRUE, col = "#9B72AA", lwd = 4, lty = c(1), type = "none")

par(new=TRUE)
fluotox24_17_model <- drm(response~Conc, data = fluo24tox_17, fct = LL.4(fixed = c(NA, NA, NA, NA)))
plot(fluotox24_17_model, add = TRUE, col = "#674C71", lwd = 4, lty = c(1), type = "none")

#48hr plots
par(new=TRUE)
fluotox48_75_model <- drm(response~Conc, data = fluo48tox_75, fct = LL.4(fixed = c(NA, NA, NA, NA)))
plot(fluotox48_75_model, add = TRUE, col = "#DCACED", lwd = 4, lty = c(2), type = "none")

par(new=TRUE)
fluotox48_78_model <- drm(response~Conc, data = fluo48tox_78, fct = LL.4(fixed = c(NA, NA, NA, NA)))
plot(fluotox48_78_model, add = TRUE, col = "#9B72AA", lwd = 4, lty = c(2), type = "none")

par(new=TRUE)
fluotox48_17_model <- drm(response~Conc, data = fluo48tox_17, fct = LL.4(fixed = c(NA, NA, 100, NA)))
plot(fluotox48_17_model, add = TRUE, col = "#674C71", lwd = 4, lty = c(2), type = "none")

#72hr plots
par(new=TRUE)
fluotox72_78_model <- drm(response~Conc, data = fluo72tox_78, fct = LL.4(fixed = c(NA, NA, 100, NA)))
plot(fluotox72_75_model, add = TRUE, col = "#DCACED", lwd = 4, lty = c(3), type = "none")

par(new=TRUE)
fluotox72_78_model <- drm(response~Conc, data = fluo72tox_78, fct = LL.4(fixed = c(NA, NA, 100, NA)))
plot(fluotox72_78_model, add = TRUE, col = "#9B72AA", lwd = 4, lty = c(3), type = "none")

par(new=TRUE)
fluotox72_17_model <- drm(response~Conc, data = fluo72tox_17, fct = LL.4(fixed = c(NA, NA, NA, NA)))
plot(fluotox72_17_model, add = TRUE, col = "#674C71", lwd = 4, lty = c(3), type = "none")

legend(x = "bottomleft", legend = c("Ind1 24hr", "Ind2 24hr", "Ind3 24hr", "Ind1 48hr", "Ind2 48hr", "Ind3 48hr", "Ind1 72hr", "Ind2 72hr", "Ind3 72hr"), lty = c(1, 1, 1, 2, 2, 2, 3, 3, 3, 1), col = rep(c("#DCACED", "#9B72AA", "#674C71"),3), lwd = 4)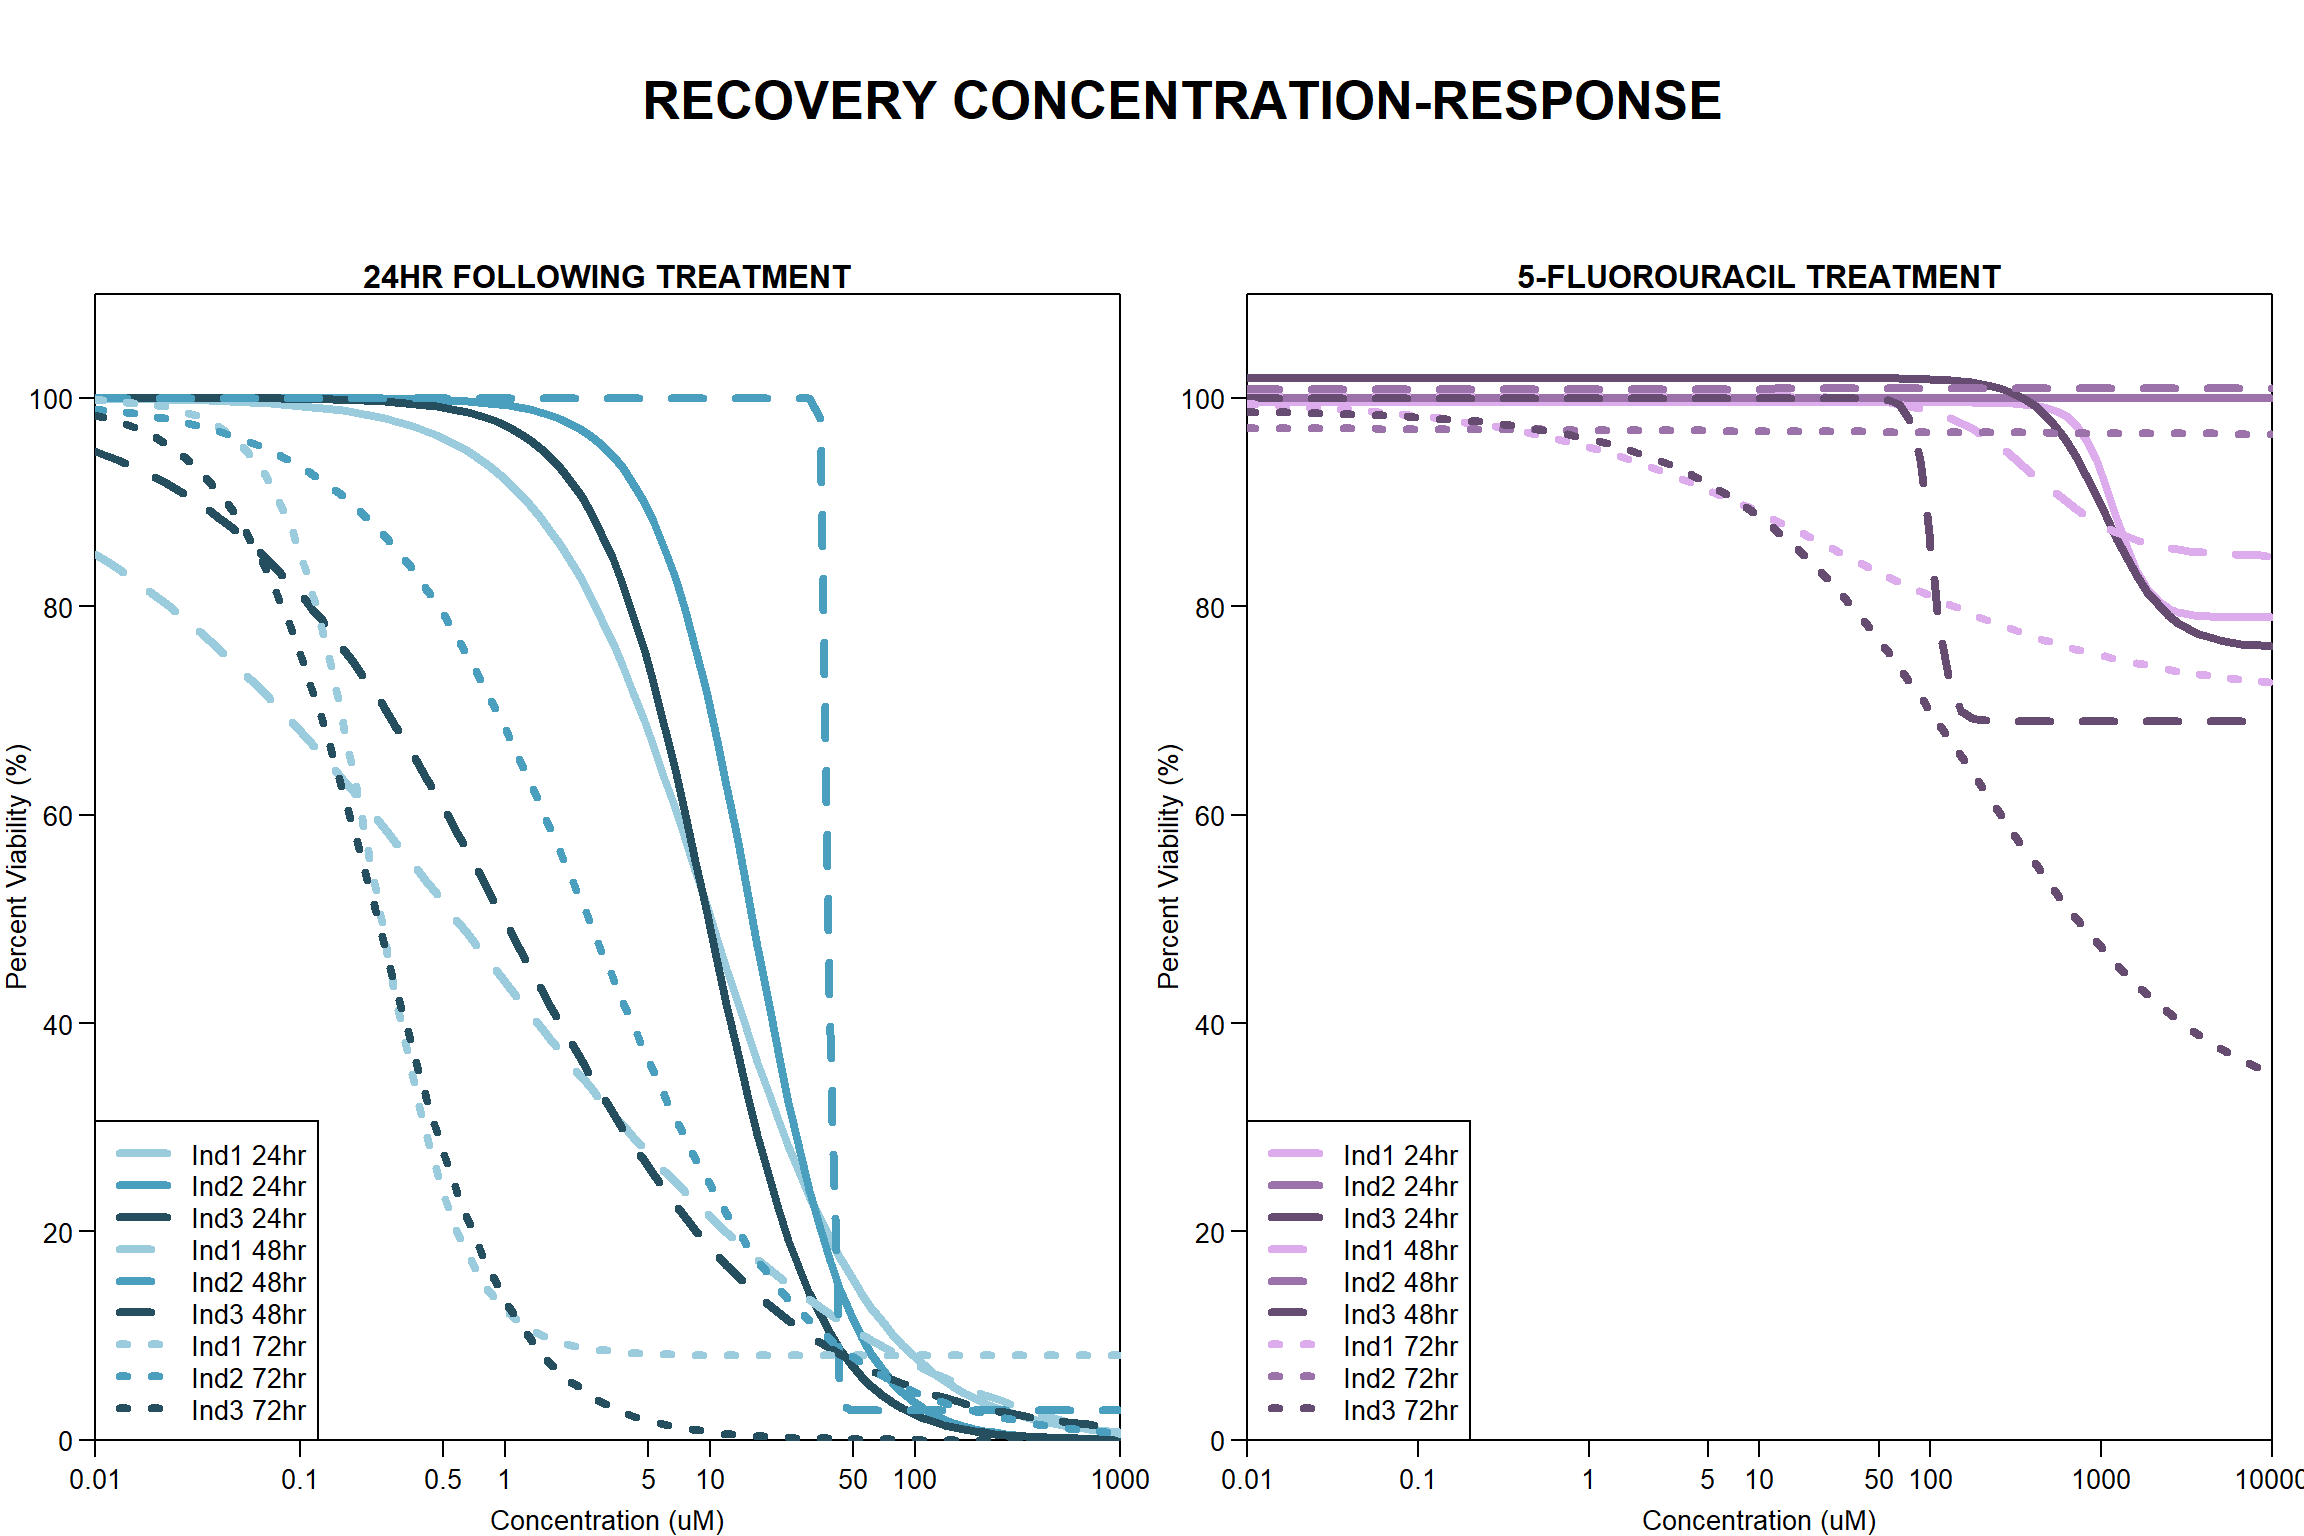
| Version | Author | Date |
|---|---|---|
| 109e14b | emmapfort | 2025-03-03 |
#had to change the legends to show all of the line types and colors
#24hr = line 1, 48hr = line 2, 72hr = line 3
sessionInfo()R version 4.4.2 (2024-10-31 ucrt)
Platform: x86_64-w64-mingw32/x64
Running under: Windows 11 x64 (build 22000)
Matrix products: default
locale:
[1] LC_COLLATE=English_United States.utf8
[2] LC_CTYPE=English_United States.utf8
[3] LC_MONETARY=English_United States.utf8
[4] LC_NUMERIC=C
[5] LC_TIME=English_United States.utf8
time zone: America/Chicago
tzcode source: internal
attached base packages:
[1] stats graphics grDevices utils datasets methods base
other attached packages:
[1] readxl_1.4.3 drc_3.0-1 MASS_7.3-61 scales_1.3.0
[5] lubridate_1.9.3 forcats_1.0.0 stringr_1.5.1 dplyr_1.1.4
[9] purrr_1.0.2 readr_2.1.5 tidyr_1.3.1 tibble_3.2.1
[13] ggplot2_3.5.1 tidyverse_2.0.0 workflowr_1.7.1
loaded via a namespace (and not attached):
[1] gtable_0.3.6 xfun_0.49 bslib_0.9.0 processx_3.8.5
[5] lattice_0.22-6 callr_3.7.6 tzdb_0.4.0 vctrs_0.6.5
[9] tools_4.4.2 ps_1.8.1 generics_0.1.3 sandwich_3.1-1
[13] pkgconfig_2.0.3 Matrix_1.7-1 lifecycle_1.0.4 compiler_4.4.2
[17] git2r_0.35.0 munsell_0.5.1 codetools_0.2-20 getPass_0.2-4
[21] carData_3.0-5 httpuv_1.6.15 htmltools_0.5.8.1 sass_0.4.9
[25] yaml_2.3.10 Formula_1.2-5 later_1.4.1 pillar_1.10.1
[29] car_3.1-3 jquerylib_0.1.4 whisker_0.4.1 cachem_1.1.0
[33] abind_1.4-8 multcomp_1.4-28 gtools_3.9.5 tidyselect_1.2.1
[37] digest_0.6.37 mvtnorm_1.3-3 stringi_1.8.4 splines_4.4.2
[41] rprojroot_2.0.4 fastmap_1.2.0 grid_4.4.2 colorspace_2.1-1
[45] cli_3.6.3 magrittr_2.0.3 survival_3.7-0 TH.data_1.1-3
[49] withr_3.0.2 promises_1.3.2 plotrix_3.8-4 timechange_0.3.0
[53] rmarkdown_2.29 httr_1.4.7 cellranger_1.1.0 zoo_1.8-12
[57] hms_1.1.3 evaluate_1.0.3 knitr_1.49 rlang_1.1.4
[61] Rcpp_1.0.13-1 glue_1.8.0 rstudioapi_0.17.1 jsonlite_1.8.9
[65] R6_2.6.1 fs_1.6.5